Answered step by step
Verified Expert Solution
Question
1 Approved Answer
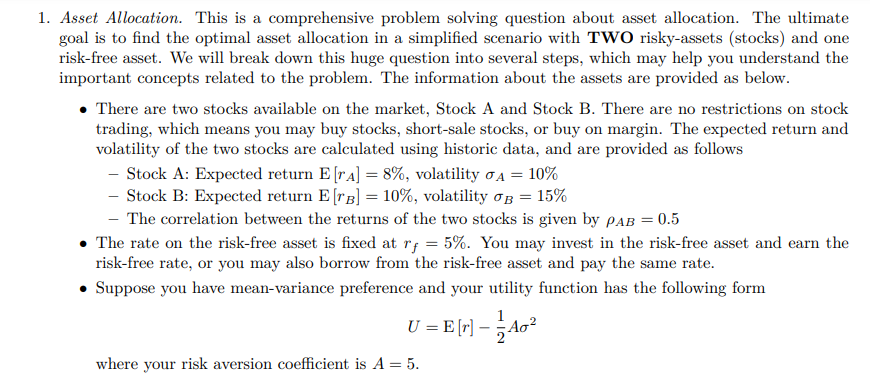
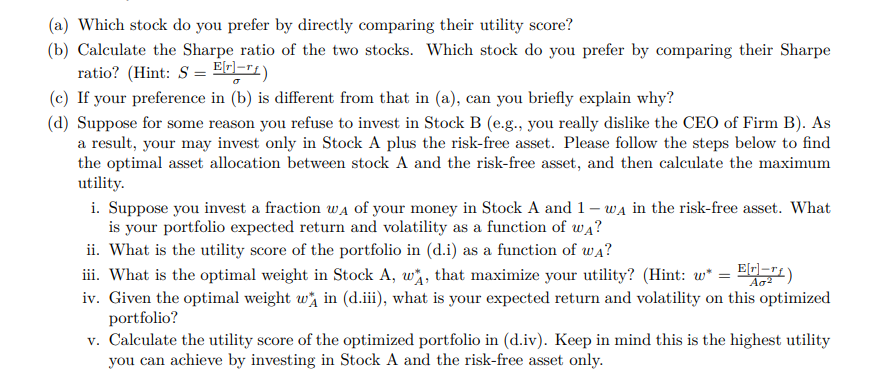
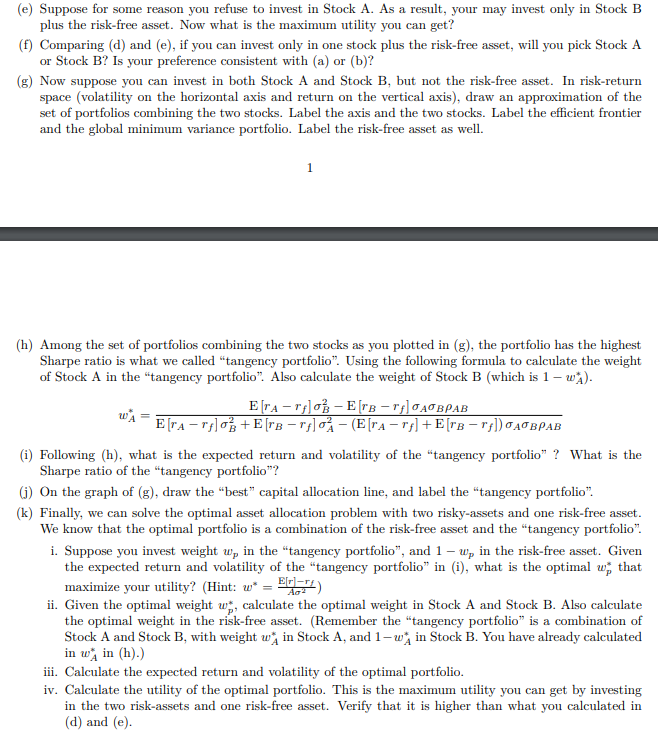
Please help me solving (h), (i), (j), (k). Include detail please. 1. Asset Allocation. This is a comprehensive problem solving question about asset allocation. The


Please help me solving (h), (i), (j), (k).
Include detail please.
1. Asset Allocation. This is a comprehensive problem solving question about asset allocation. The ultimate goal is to find the optimal asset allocation in a simplified scenario with TWO risky-assets (stocks) and one risk-free asset. We will break down this huge question into several steps, which may help you understand the important concepts related to the problem. The information about the assets are provided as below. There are two stocks available on the market, Stock A and Stock B. There are no restrictions on stock trading, which means you may buy stocks, short-sale stocks, or buy on margin. The expected return and volatility of the two stocks are calculated using historic data, and are provided as follows - Stock A: Expected return E [ra] = 8%, volatility QA = 10% - Stock B: Expected return E [TB] = 10%, volatility Ob = 15% - The correlation between the returns of the two stocks is given by PAB = 0.5 The rate on the risk-free asset is fixed at ry = 5%. You may invest in the risk-free asset and earn the risk-free rate, or you may also borrow from the risk-free asset and pay the same rate. Suppose you have mean-variance preference and your utility function has the following form 1 U = E[r] 5402 where your risk aversion coefficient is A = 5. (a) Which stock do you prefer by directly comparing their utility score? (b) Calculate the Sharpe ratio of the two stocks. Which stock do you prefer by comparing their Sharpe ratio? (Hint: S = E[r]="1) (c) If your preference in (b) is different from that in (a), can you briefly explain why? (a) Suppose for some reason you refuse to invest in Stock B (e.g., you really dislike the CEO of Firm B). As a result, your may invest only in Stock A plus the risk-free asset. Please follow the steps below to find the optimal asset allocation between stock A and the risk-free asset, and then calculate the maximum utility. i. Suppose you invest a fraction wa of your money in Stock A and 1 - WA in the risk-free asset. What is your portfolio expected return and volatility as a function of wa? ii. What is the utility score of the portfolio in (d.i) as a function of wa? iii. What is the optimal weight in Stock A, wn, that maximize your utility? (Hint: w* = Eno") iv. Given the optimal weight w1 in (d.iii), what is your expected return and volatility on this optimized portfolio? v. Calculate the utility score of the optimized portfolio in (d.iv). Keep in mind this is the highest utility you can achieve by investing in Stock A and the risk-free asset only. (e) Suppose for some reason you refuse to invest in Stock A. As a result, your may invest only in Stock B plus the risk-free asset. Now what is the maximum utility you can get? (f) Comparing (d) and (e), if you can invest only in one stock plus the risk-free asset, will you pick Stock A or Stock B? Is your preference consistent with (a) or (b)? (8) Now suppose you can invest in both Stock A and Stock B, but not the risk-free asset. In risk-return space (volatility on the horizontal axis and return on the vertical axis), draw an approximation of the set of portfolios combining the two stocks. Label the axis and the two stocks. Label the efficient frontier and the global minimum variance portfolio. Label the risk-free asset as well. (h) Among the set of portfolios combining the two stocks as you plotted in (g), the portfolio has the highest Sharpe ratio is what we called "tangency portfolio". Using the following formula to calculate the weight of Stock A in the "tangency portfolio". Also calculate the weight of Stock B (which is 1 - w^). ETA-rpo - E[re-rp]TABPAB w E[TA-r03 +E[TB-rp] - (E[TA-rf]+E[TB-r)OADBPAB (i) Following (h), what is the expected return and volatility of the "tangency portfolio" ? What is the Sharpe ratio of the "tangency portfolio"? () On the graph of (g), draw the "best" capital allocation line, and label the "tangency portfolio". (k) Finally, we can solve the optimal asset allocation problem with two risky-assets and one risk-free asset. We know that the optimal portfolio is a combination of the risk-free asset and the "tangency portfolio". i. Suppose you invest weight w, in the "tangency portfolio", and 1 - w, in the risk-free asset. Given the expected return and volatility of the "tangency portfolio" in (i), what is the optimal w that maximize your utility? (Hint: w* = ENT) ii. Given the optimal weight w., calculate the optimal weight in Stock A and Stock B. Also calculate the optimal weight in the risk-free asset. (Remember the "tangency portfolio" is a combination of Stock A and Stock B, with weight w, in Stock A, and 1-win Stock B. You have already calculated in w, in (h).) iii. Calculate the expected return and volatility of the optimal portfolio. iv. Calculate the utility of the optimal portfolio. This is the maximum utility you can get by investing in the two risk-assets and one risk-free asset. Verify that it is higher than what you calculated in (d) and (e). Aas 1. Asset Allocation. This is a comprehensive problem solving question about asset allocation. The ultimate goal is to find the optimal asset allocation in a simplified scenario with TWO risky-assets (stocks) and one risk-free asset. We will break down this huge question into several steps, which may help you understand the important concepts related to the problem. The information about the assets are provided as below. There are two stocks available on the market, Stock A and Stock B. There are no restrictions on stock trading, which means you may buy stocks, short-sale stocks, or buy on margin. The expected return and volatility of the two stocks are calculated using historic data, and are provided as follows - Stock A: Expected return E [ra] = 8%, volatility QA = 10% - Stock B: Expected return E [TB] = 10%, volatility Ob = 15% - The correlation between the returns of the two stocks is given by PAB = 0.5 The rate on the risk-free asset is fixed at ry = 5%. You may invest in the risk-free asset and earn the risk-free rate, or you may also borrow from the risk-free asset and pay the same rate. Suppose you have mean-variance preference and your utility function has the following form 1 U = E[r] 5402 where your risk aversion coefficient is A = 5. (a) Which stock do you prefer by directly comparing their utility score? (b) Calculate the Sharpe ratio of the two stocks. Which stock do you prefer by comparing their Sharpe ratio? (Hint: S = E[r]="1) (c) If your preference in (b) is different from that in (a), can you briefly explain why? (a) Suppose for some reason you refuse to invest in Stock B (e.g., you really dislike the CEO of Firm B). As a result, your may invest only in Stock A plus the risk-free asset. Please follow the steps below to find the optimal asset allocation between stock A and the risk-free asset, and then calculate the maximum utility. i. Suppose you invest a fraction wa of your money in Stock A and 1 - WA in the risk-free asset. What is your portfolio expected return and volatility as a function of wa? ii. What is the utility score of the portfolio in (d.i) as a function of wa? iii. What is the optimal weight in Stock A, wn, that maximize your utility? (Hint: w* = Eno") iv. Given the optimal weight w1 in (d.iii), what is your expected return and volatility on this optimized portfolio? v. Calculate the utility score of the optimized portfolio in (d.iv). Keep in mind this is the highest utility you can achieve by investing in Stock A and the risk-free asset only. (e) Suppose for some reason you refuse to invest in Stock A. As a result, your may invest only in Stock B plus the risk-free asset. Now what is the maximum utility you can get? (f) Comparing (d) and (e), if you can invest only in one stock plus the risk-free asset, will you pick Stock A or Stock B? Is your preference consistent with (a) or (b)? (8) Now suppose you can invest in both Stock A and Stock B, but not the risk-free asset. In risk-return space (volatility on the horizontal axis and return on the vertical axis), draw an approximation of the set of portfolios combining the two stocks. Label the axis and the two stocks. Label the efficient frontier and the global minimum variance portfolio. Label the risk-free asset as well. (h) Among the set of portfolios combining the two stocks as you plotted in (g), the portfolio has the highest Sharpe ratio is what we called "tangency portfolio". Using the following formula to calculate the weight of Stock A in the "tangency portfolio". Also calculate the weight of Stock B (which is 1 - w^). ETA-rpo - E[re-rp]TABPAB w E[TA-r03 +E[TB-rp] - (E[TA-rf]+E[TB-r)OADBPAB (i) Following (h), what is the expected return and volatility of the "tangency portfolio" ? What is the Sharpe ratio of the "tangency portfolio"? () On the graph of (g), draw the "best" capital allocation line, and label the "tangency portfolio". (k) Finally, we can solve the optimal asset allocation problem with two risky-assets and one risk-free asset. We know that the optimal portfolio is a combination of the risk-free asset and the "tangency portfolio". i. Suppose you invest weight w, in the "tangency portfolio", and 1 - w, in the risk-free asset. Given the expected return and volatility of the "tangency portfolio" in (i), what is the optimal w that maximize your utility? (Hint: w* = ENT) ii. Given the optimal weight w., calculate the optimal weight in Stock A and Stock B. Also calculate the optimal weight in the risk-free asset. (Remember the "tangency portfolio" is a combination of Stock A and Stock B, with weight w, in Stock A, and 1-win Stock B. You have already calculated in w, in (h).) iii. Calculate the expected return and volatility of the optimal portfolio. iv. Calculate the utility of the optimal portfolio. This is the maximum utility you can get by investing in the two risk-assets and one risk-free asset. Verify that it is higher than what you calculated in (d) and (e). AasStep by Step Solution
There are 3 Steps involved in it
Step: 1

Get Instant Access to Expert-Tailored Solutions
See step-by-step solutions with expert insights and AI powered tools for academic success
Step: 2

Step: 3

Ace Your Homework with AI
Get the answers you need in no time with our AI-driven, step-by-step assistance
Get Started


