please help me tackle the assignments below
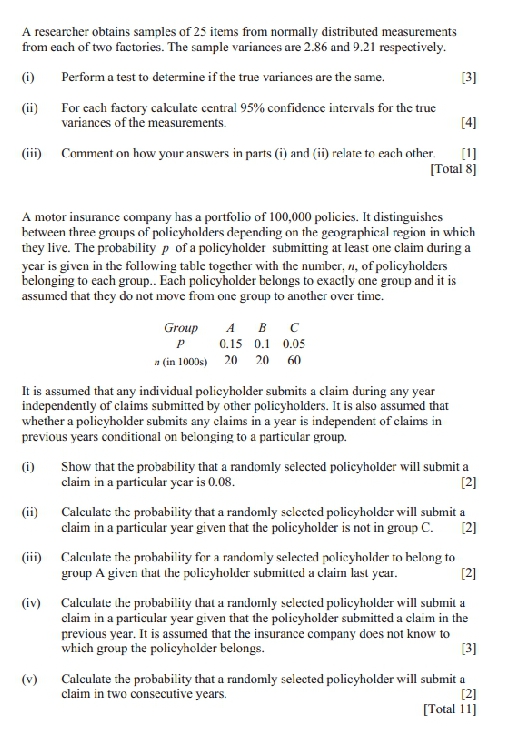
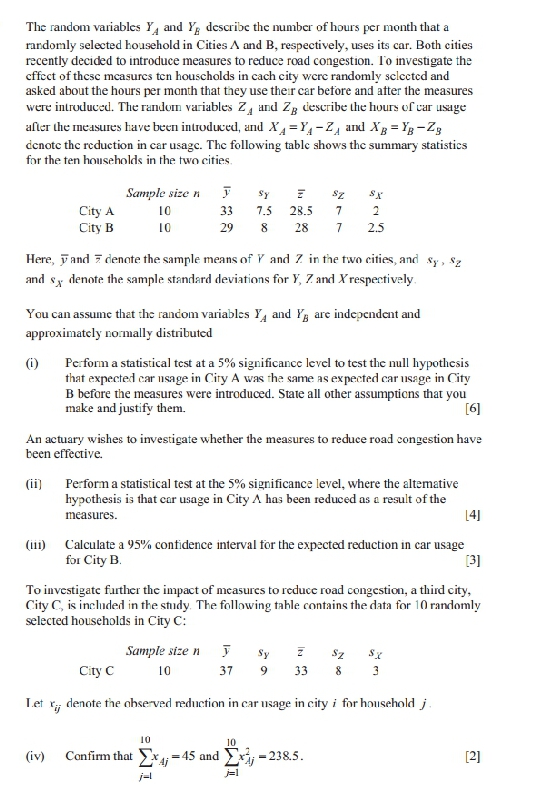
A researcher obtains samples of 25 items from normally distributed measurements from each of two factories. The sample variances are 2.86 and 9.21 respectively. (i) Perform a test to determine if the true variances are the same. [3] (ii) For each factory calculate central 95% confidence intervals for the true variances of the measurements. [4] (iii) Comment on how your answers in parts (i) and (ii) relate to each other. [Total 8] A motor insurance company has a portfolio of 100,000 policies. It distinguishes between three groups of policyholders depending on the geographical region in which they live. The probability p of a policyholder submitting at least one claim during a year is given in the following table together with the number, n, of policyholders belonging to each group.. Each policyholder belongs to exactly one group and it is assumed that they do not move from one group to another over time. Group A B C P 0.15 0.1 0.05 a (in 1000s) 20 20 60 It is assumed that any individual policyholder submits a claim during any year independently of claims submitted by other policyholders. It is also assumed that whether a policyholder submits any claims in a year is independent of claims in previous years conditional on belonging to a particular group. (i) Show that the probability that a randomly selected policyholder will submit a claim in a particular year is 0.08. [2] Calculate the probability that a randomly selected policyholder will submit a claim in a particular year given that the policyholder is not in group C. [2] Calculate the probability for a randomly selected policyholder to belong to group A given that the policyholder submitted a claim last year. [2] (iv) Calculate the probability that a randomly selected policyholder will submit a claim in a particular year given that the policyholder submitted a claim in the previous year. It is assumed that the insurance company does not know to which group the policyholder belongs. [3] (v) Calculate the probability that a randomly selected policyholder will submit a claim in two consecutive years. [2] [Total 11]The random variables Y, and Y's describe the number of hours per month that a randomly selected household in Cities A and B, respectively, uses its car. Both cities recently decided to introduce measures to reduce road congestion. To investigate the effect of these measures ton households in cach city were randomly selected and asked about the hours per month that they use their car before and after the measures were introduced. The random variables Zy and 7p describe the hours of car usage after the measures have been introduced, and XA = YA -Z, and Ng = Y; -Zg denote the reduction in car usage. The following table shows the summary statistics for the ten households in the two cities Sample size A SY SZ SX City A 10 33 7.5 28.5 7 2 City B 10 29 8 28 7 2.5 Here, y and 7 denote the sample means of Y and Z in the two cities, and Sy , $2 and sy denote the sample standard deviations for Y, 7. and Xrespectively. You can assume that the random variables Y, and Y's are independent and approximately normally distributed (i) Perform a statistical test at a 5% significance level to test the null hypothesis that expected car usage in City A was the same as expected car usage in City B before the measures were introduced. State all other assumptions that you make and justify them. [6] An actuary wishes to investigate whether the measures to reduce road congestion have been effective. (ii] Perform a statistical test at the 5% significance level, where the alternative hypothesis is that cor usage in City A has been reduced as a result of the measures. 141 (tii) Calculate a 95% confidence interval for the expected reduction in car usage for City B. [3] To investigate further the impact of measures to reduce road congestion, a third city, City C, is included in the study. The following table contains the data for 10 randomly selected households in City C: Sample size n Sy SZ SX City C 10 37 9 33 Let ro denote the observed reduction in car usage in city i for household j 10 10 (iv) Confirm that ) x =45 and ; -238.5. [2]