Please help me the following questions
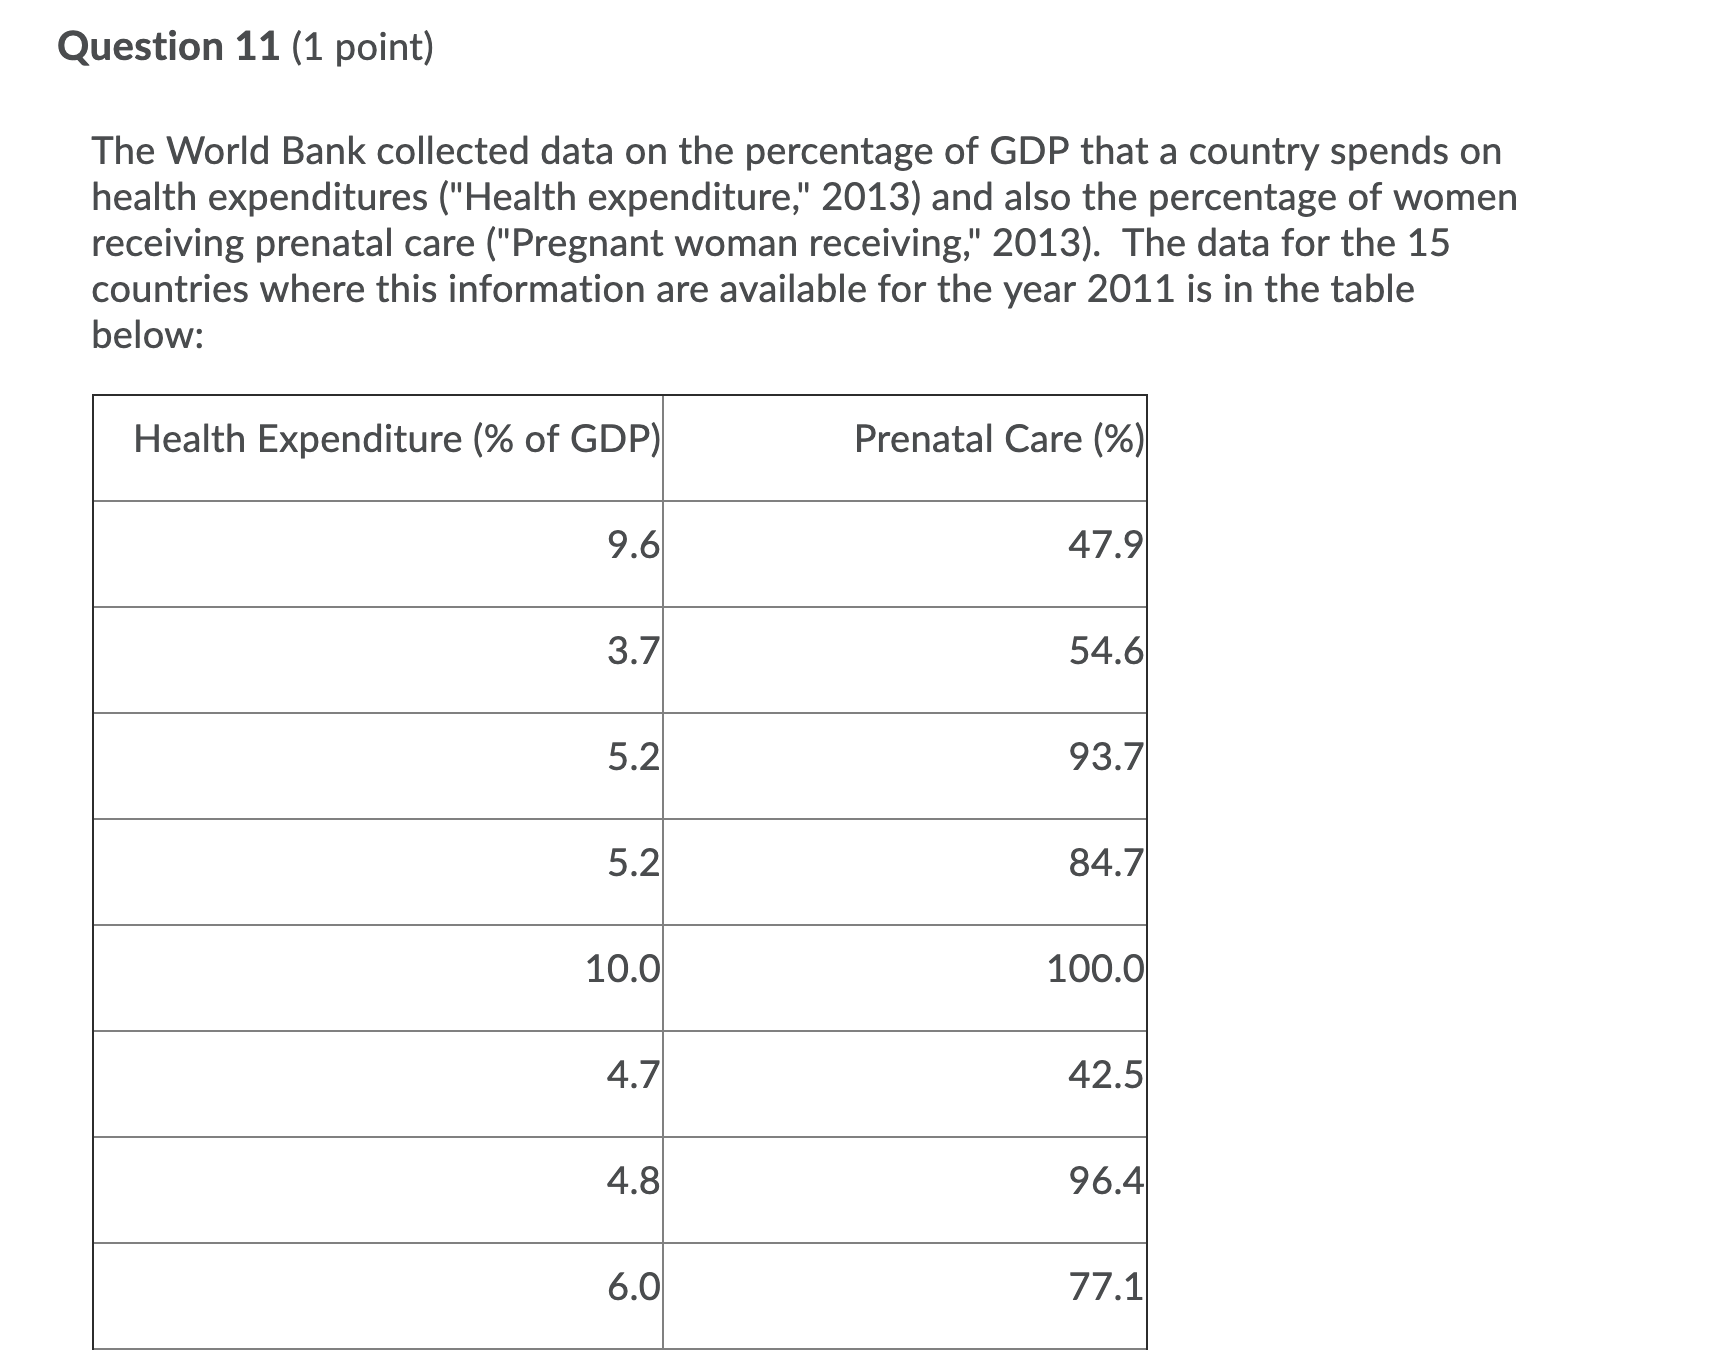
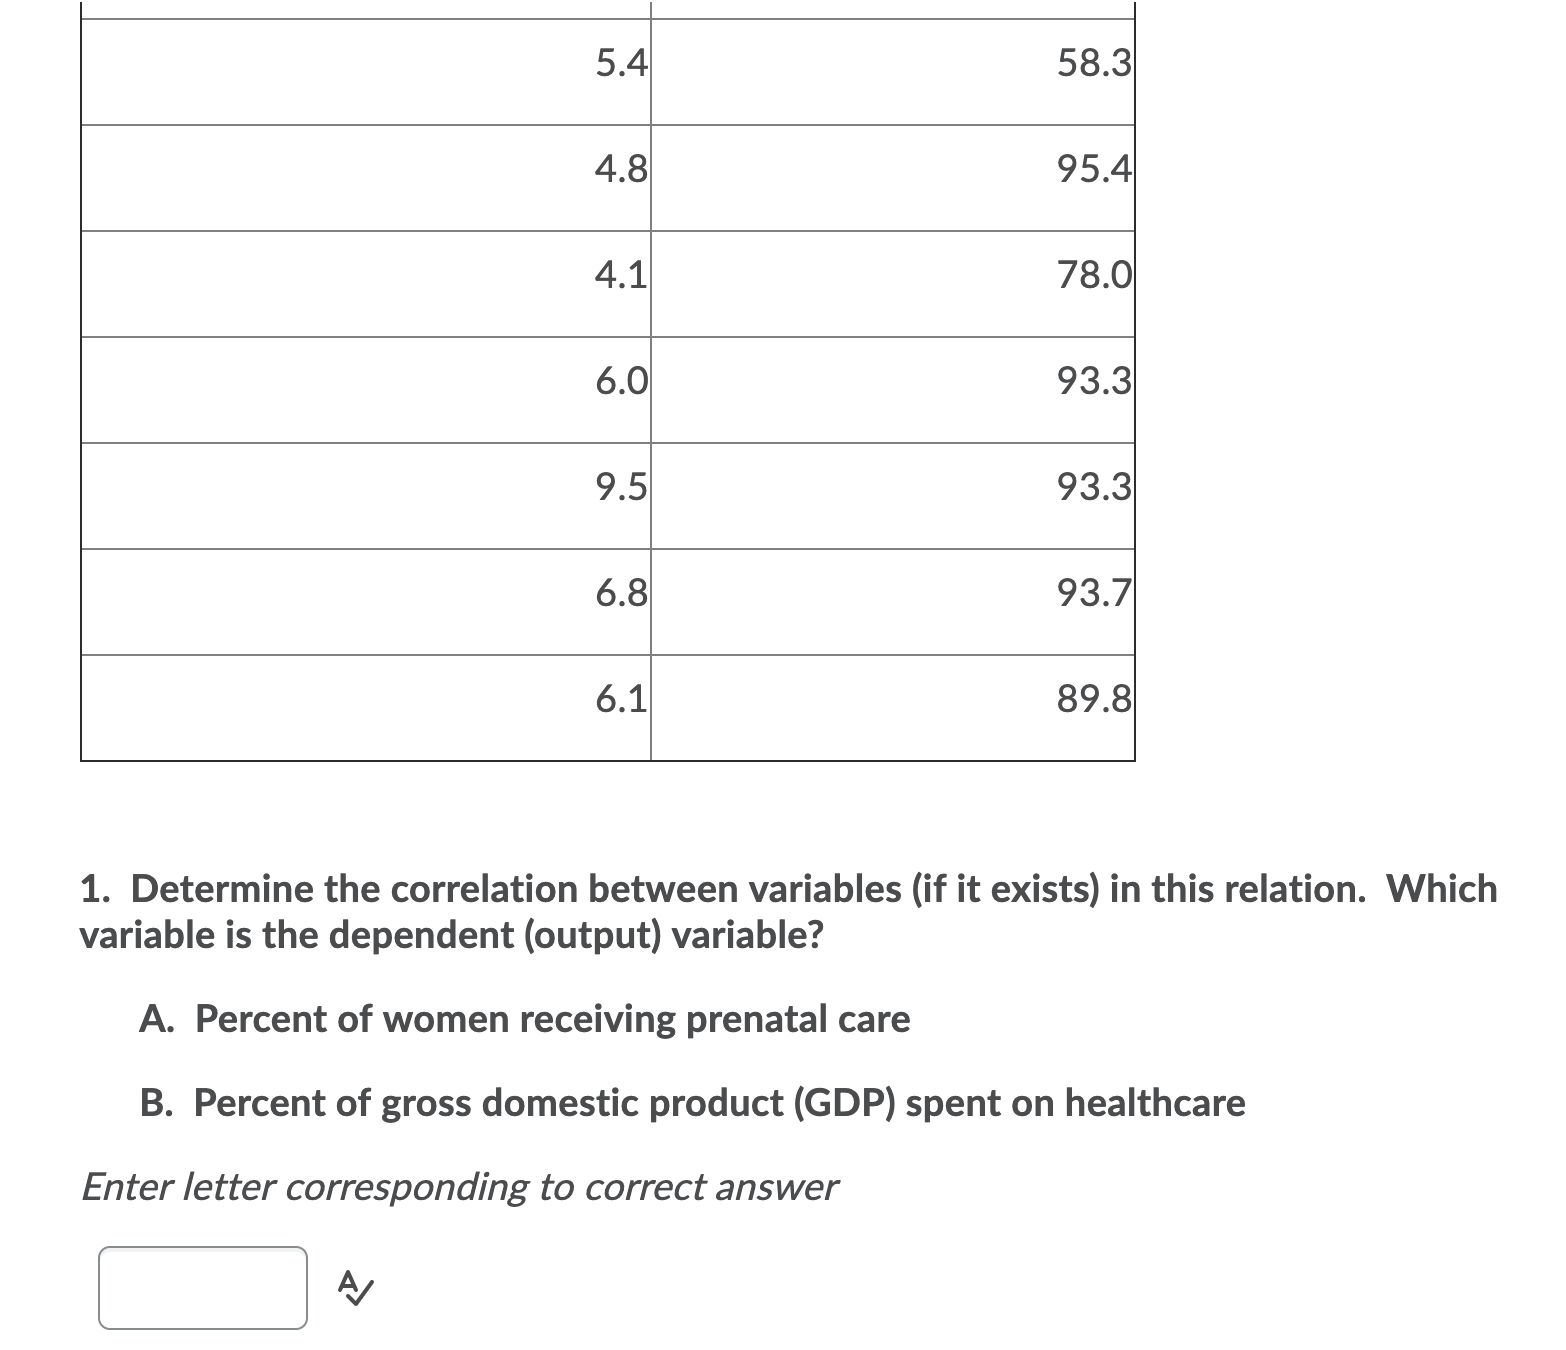
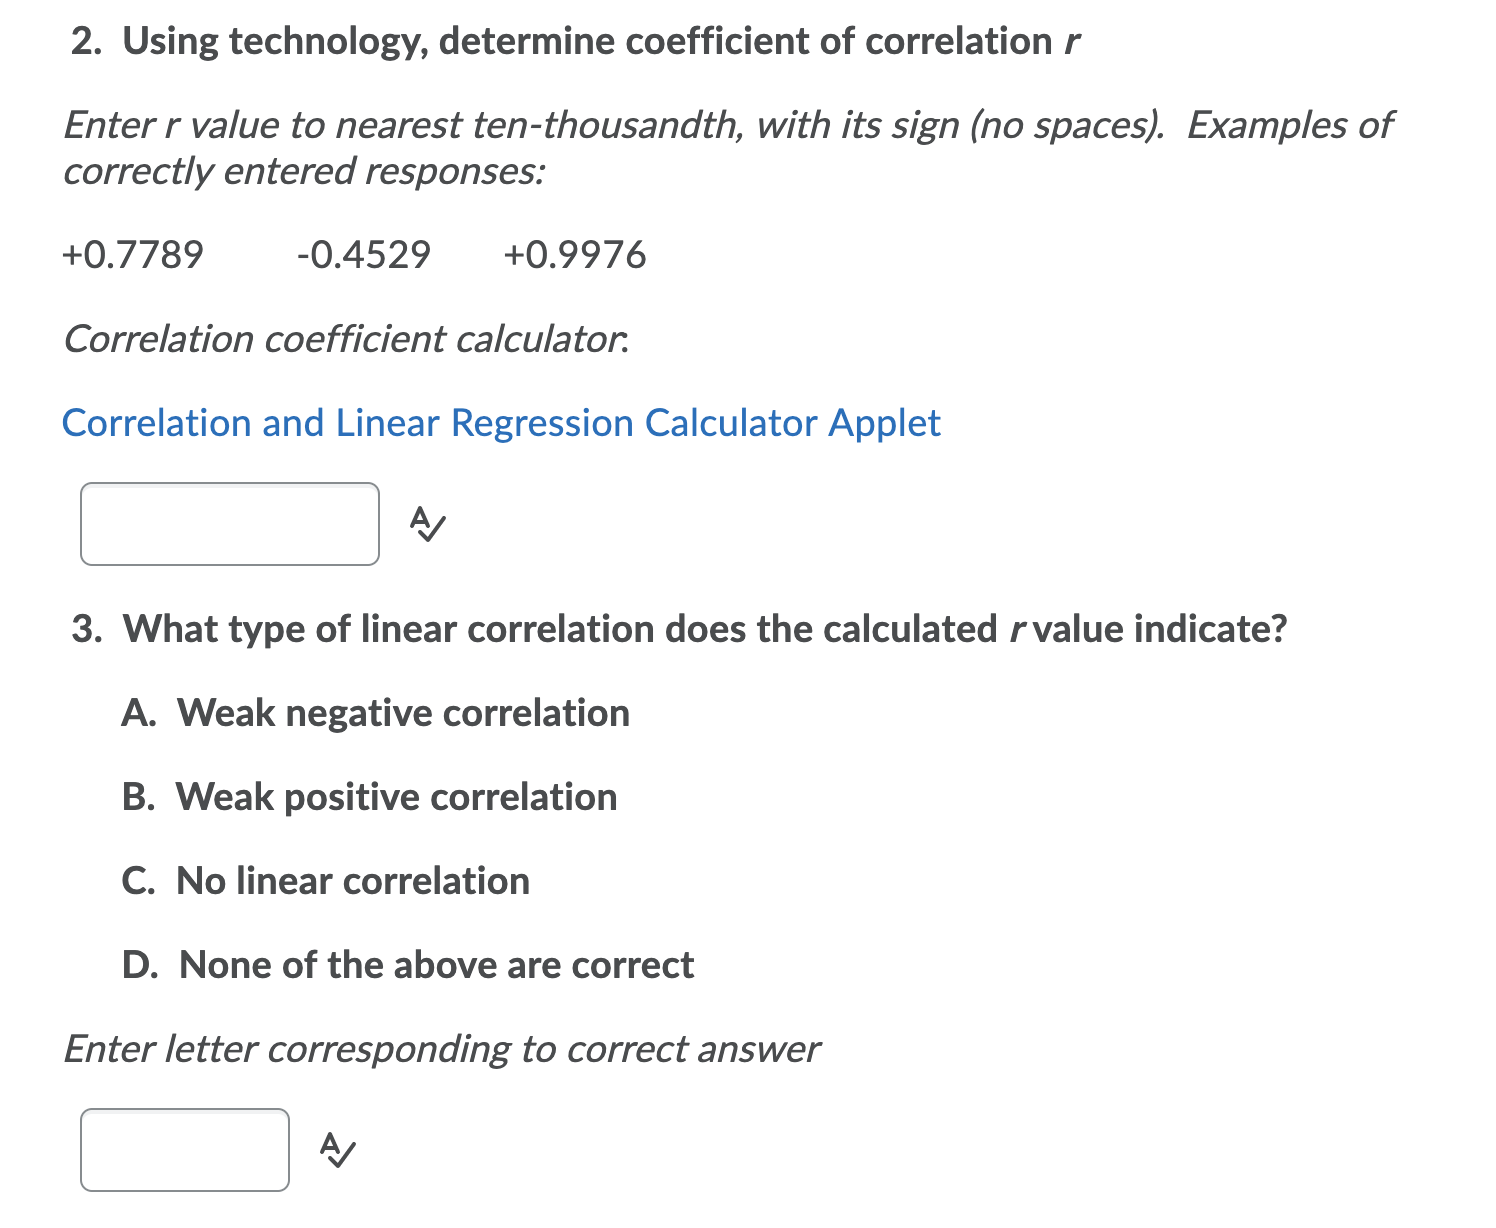
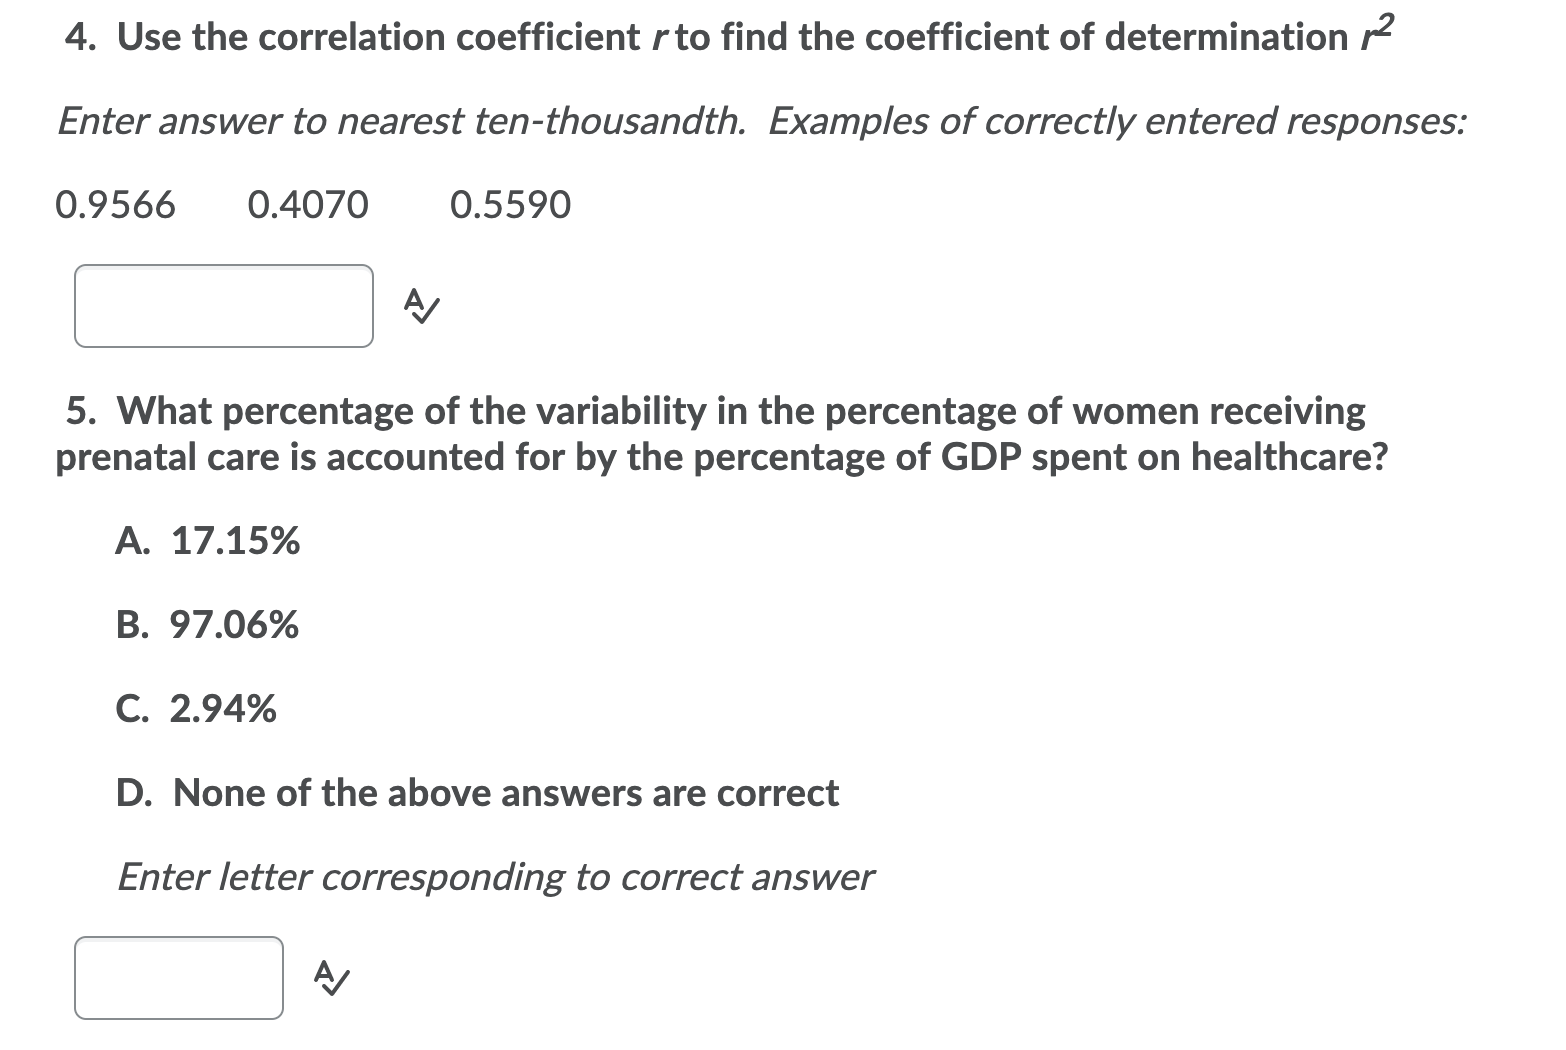
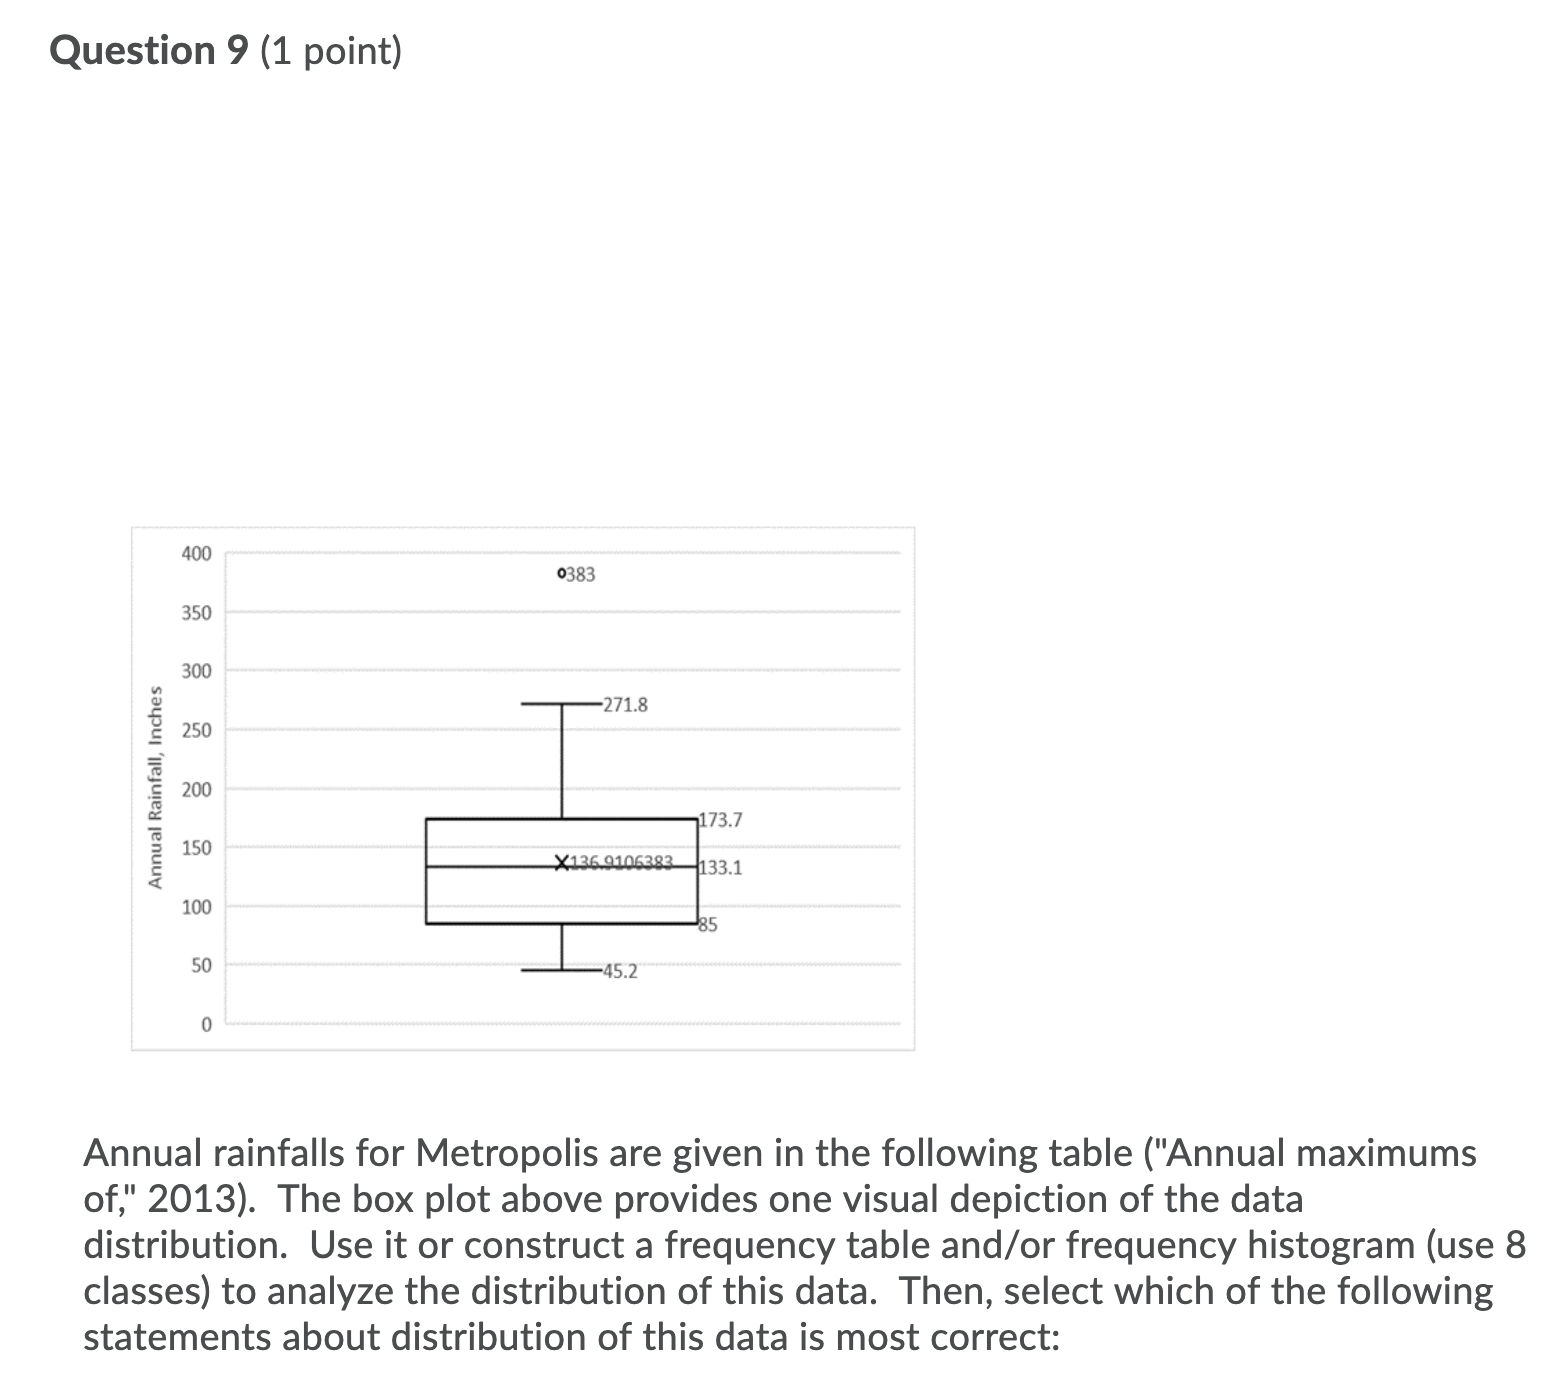
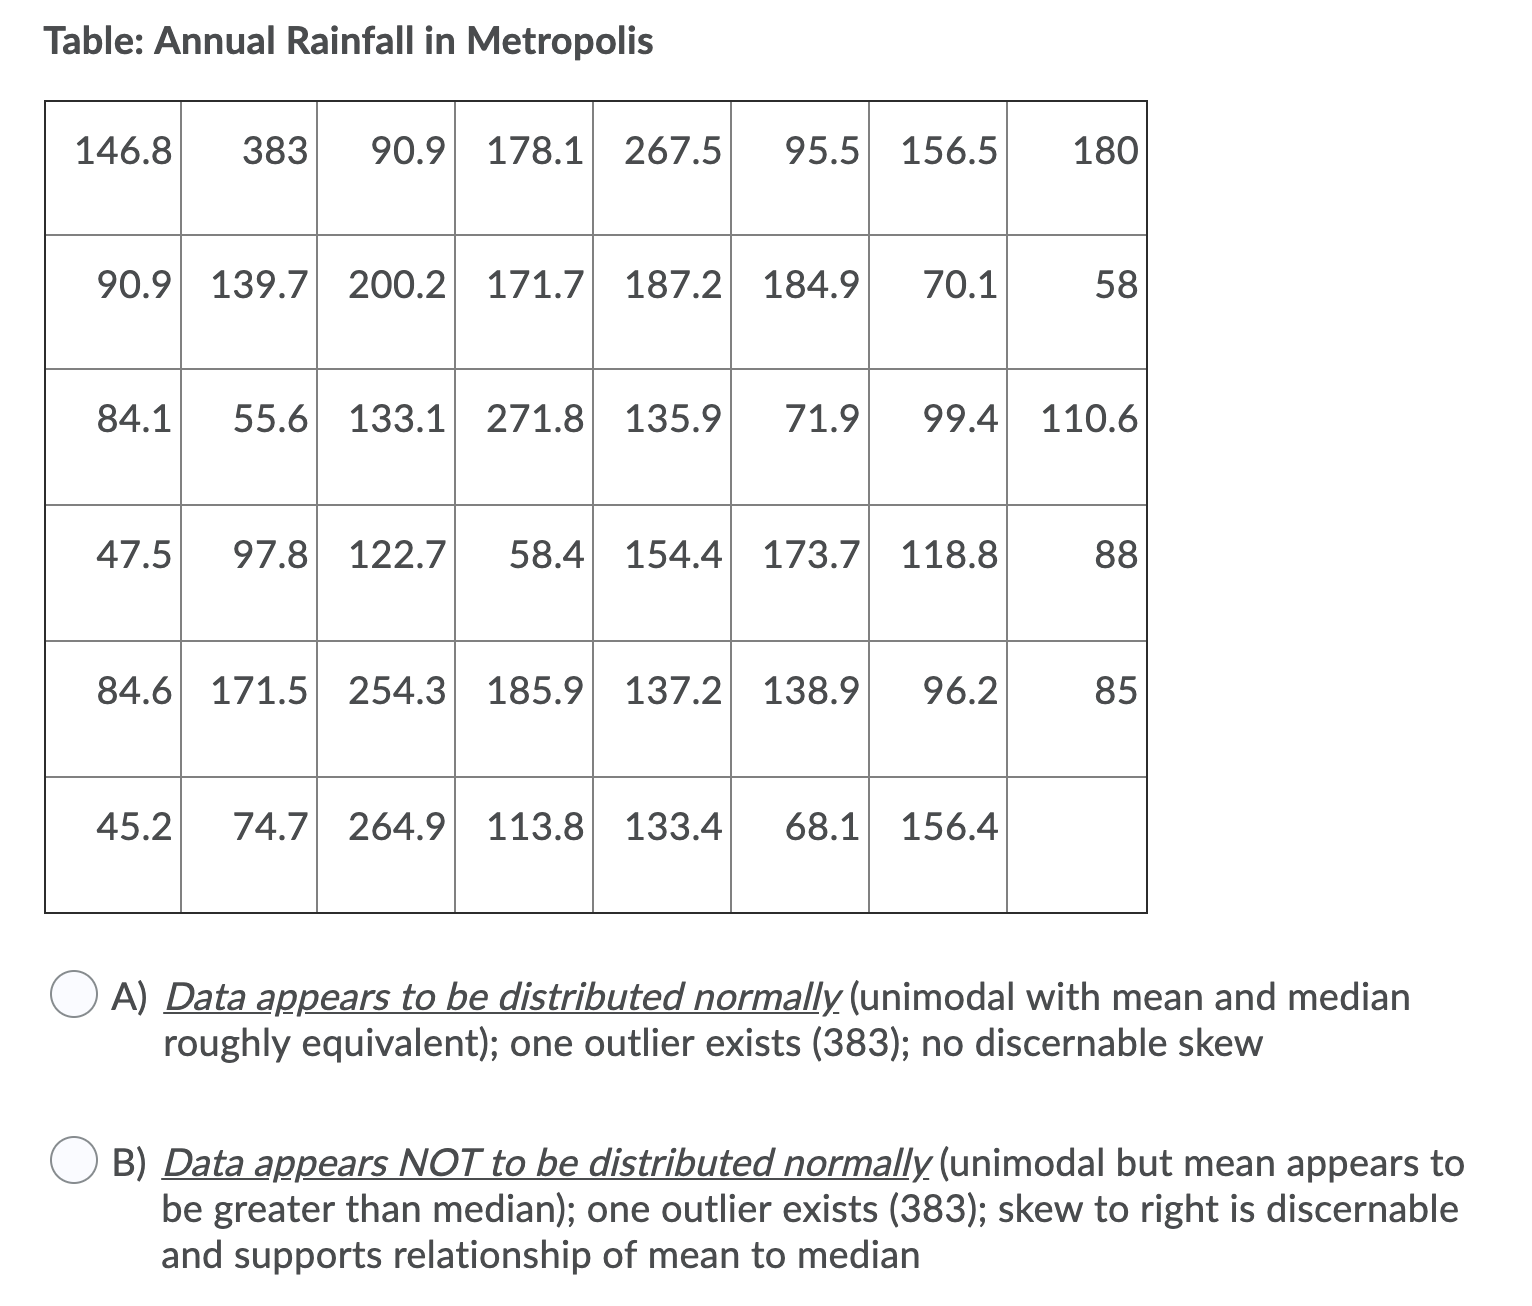
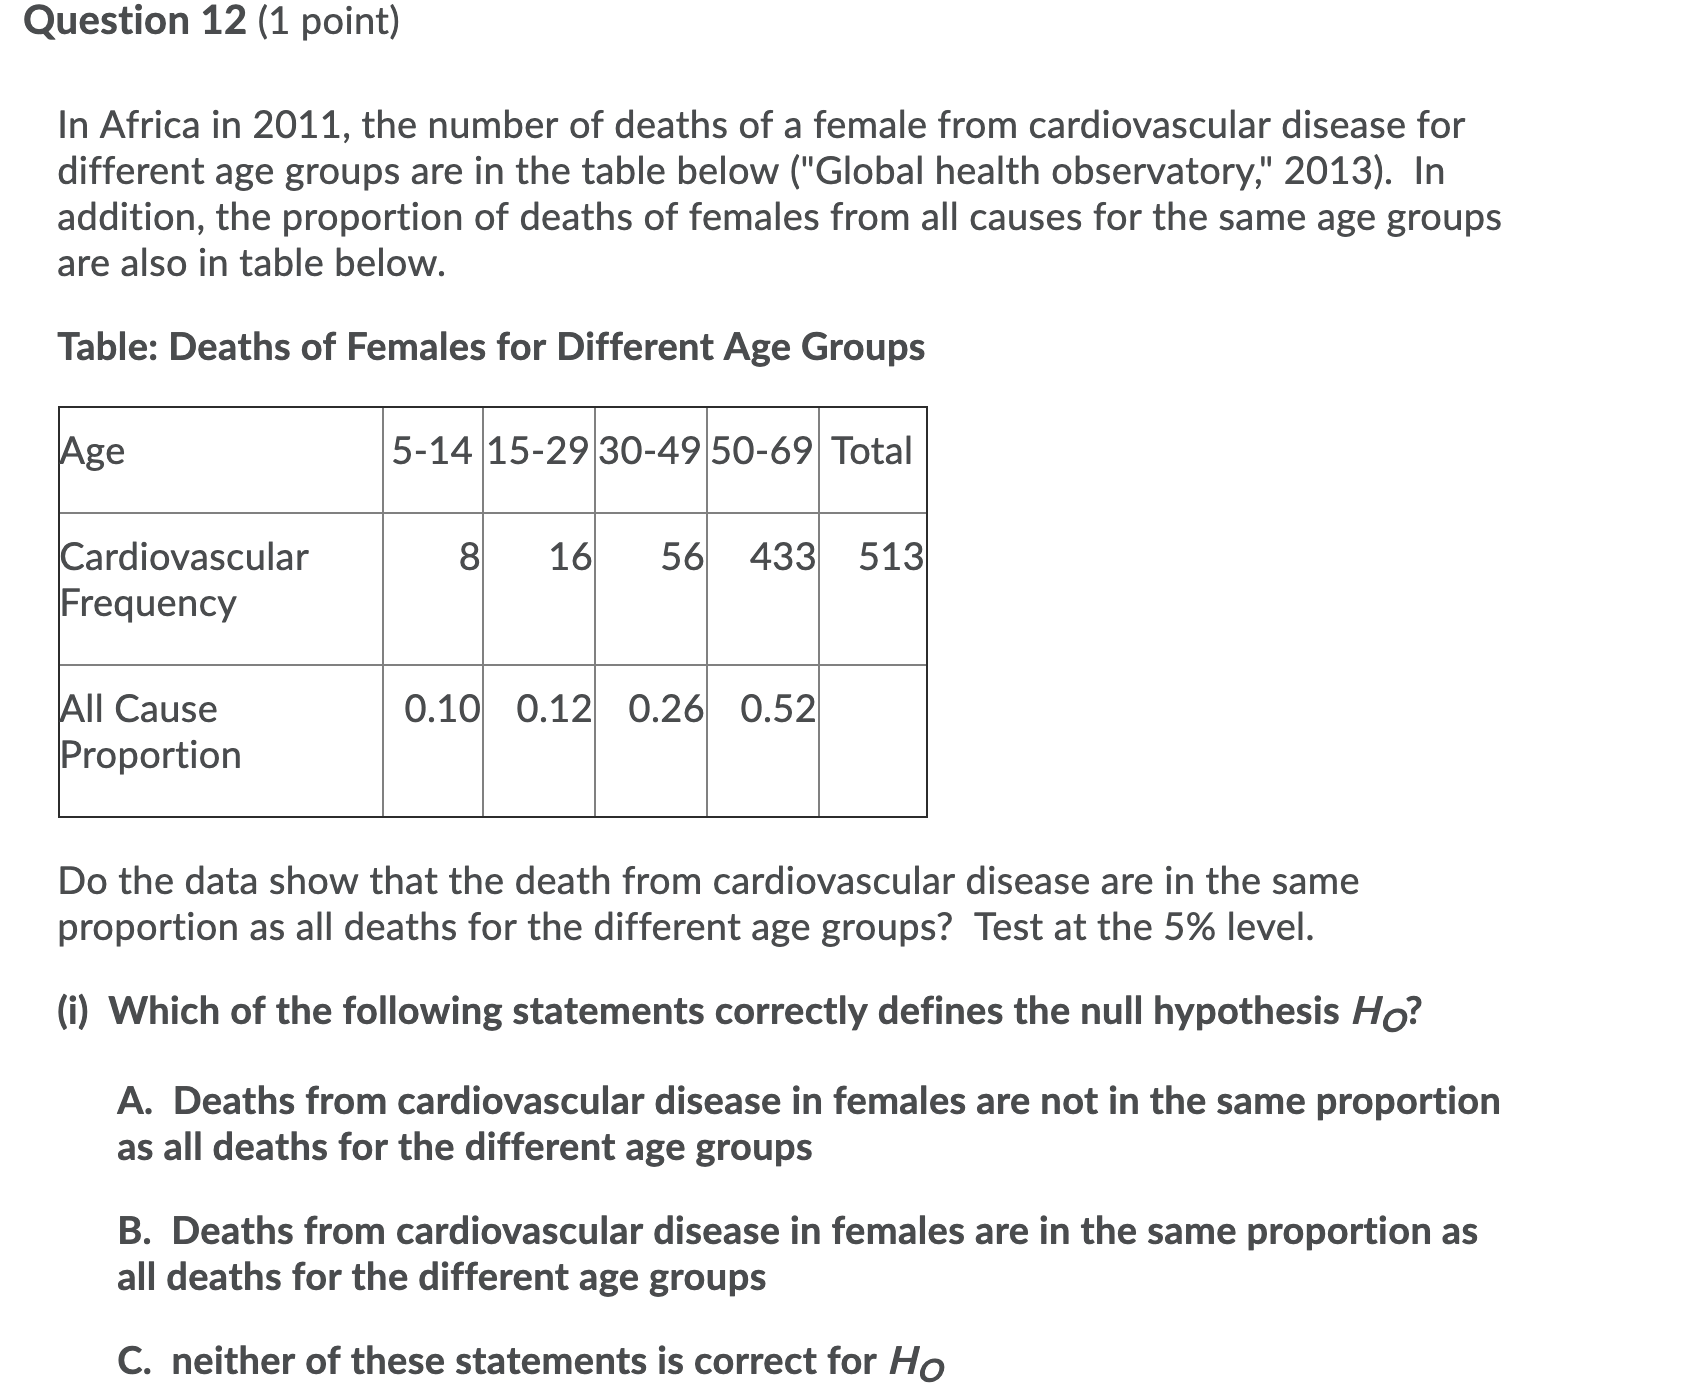
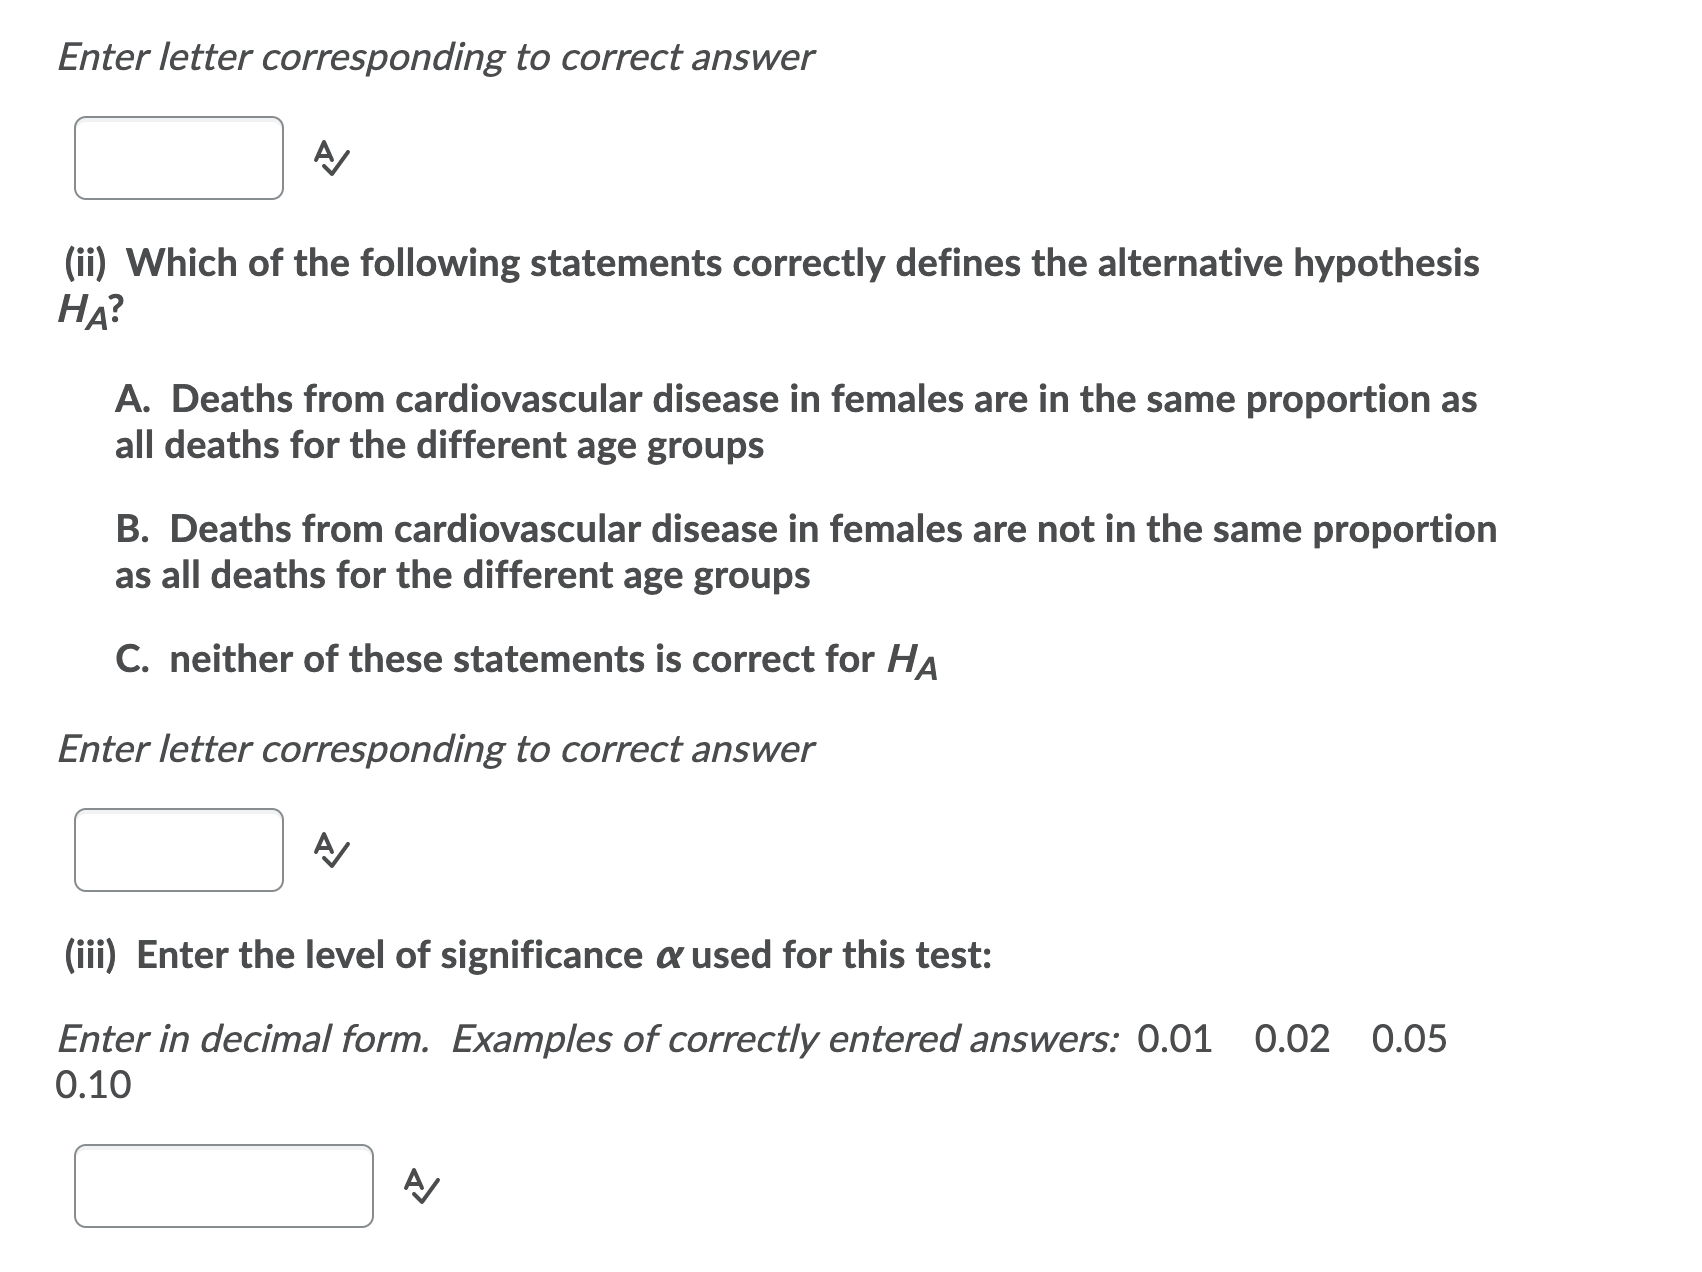
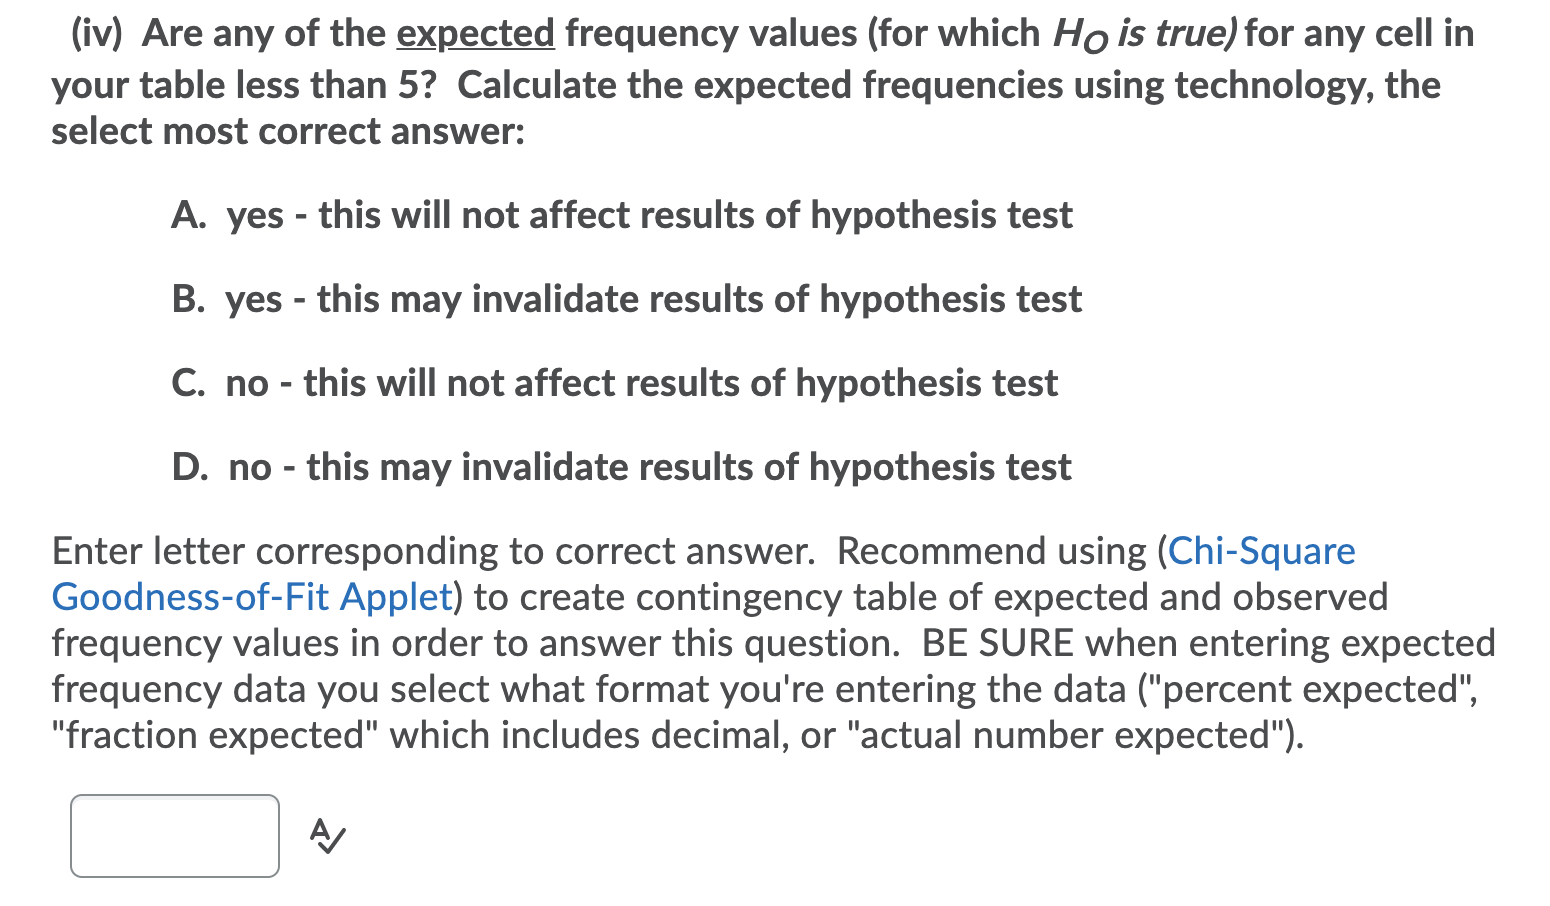
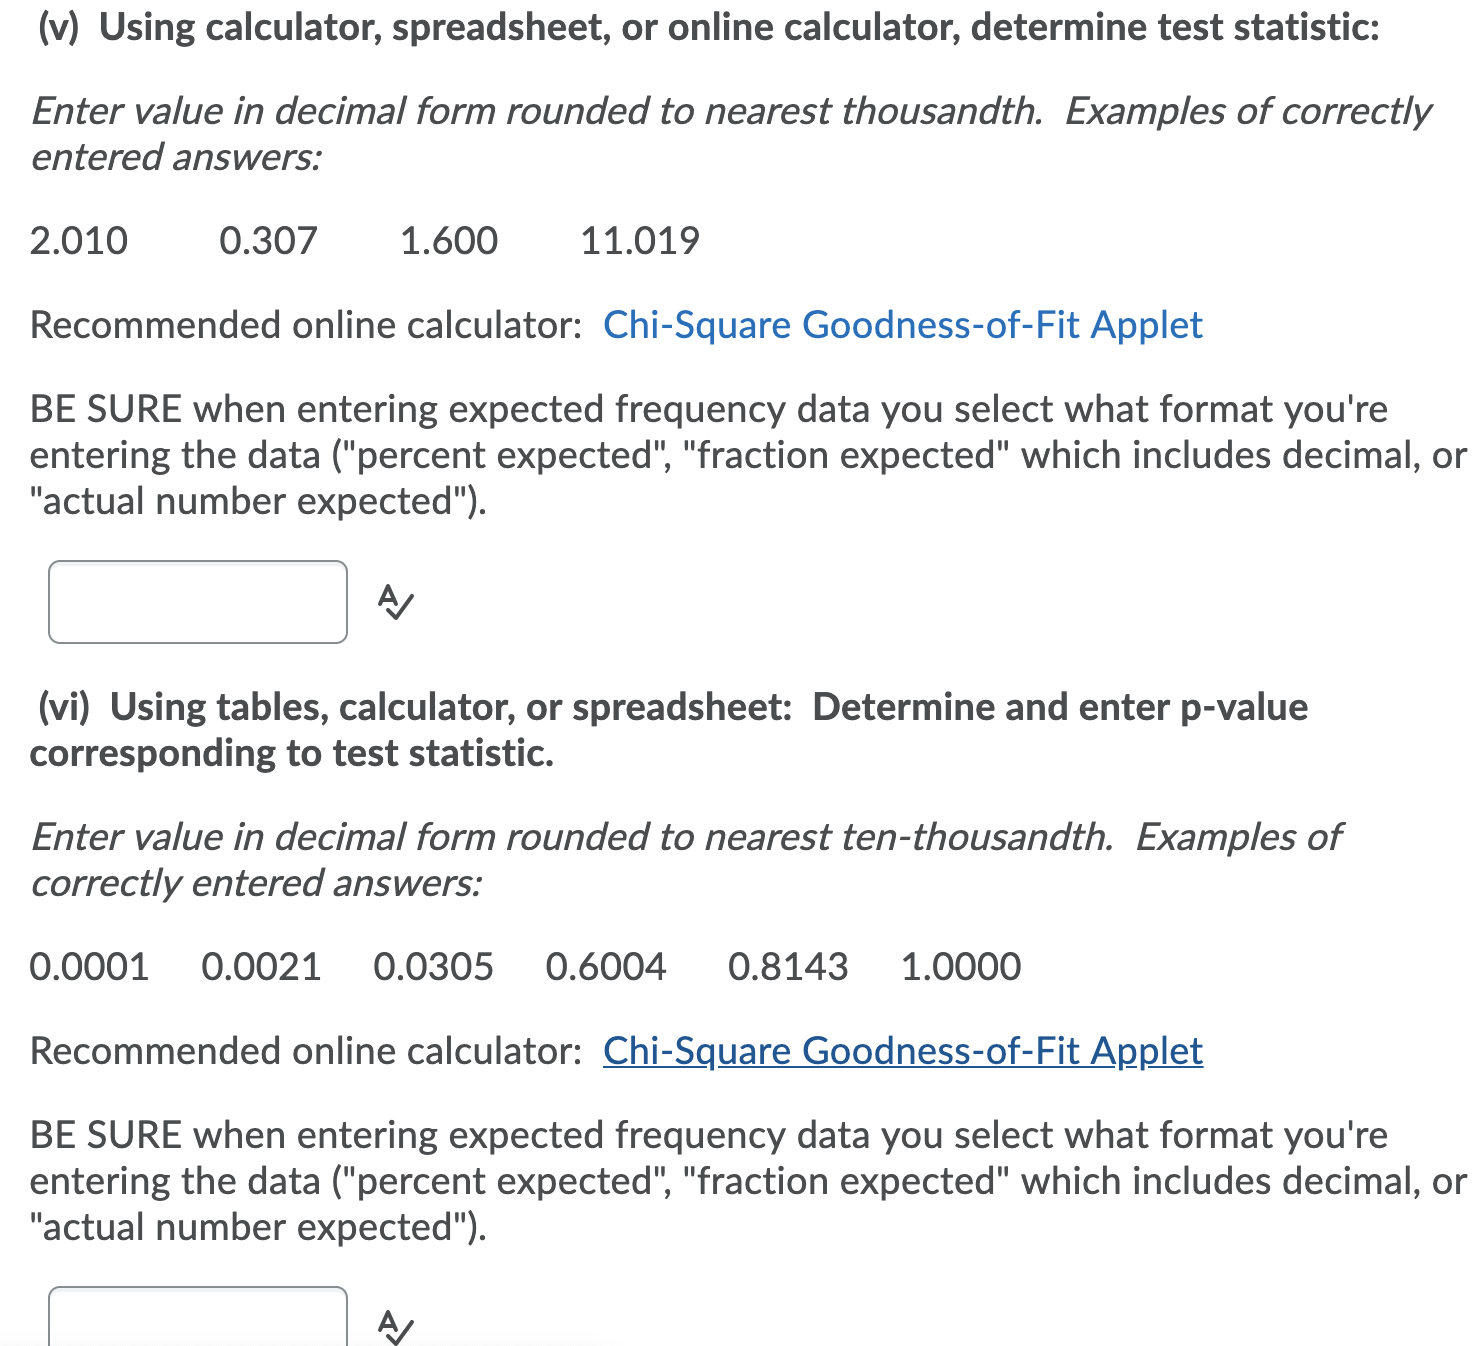
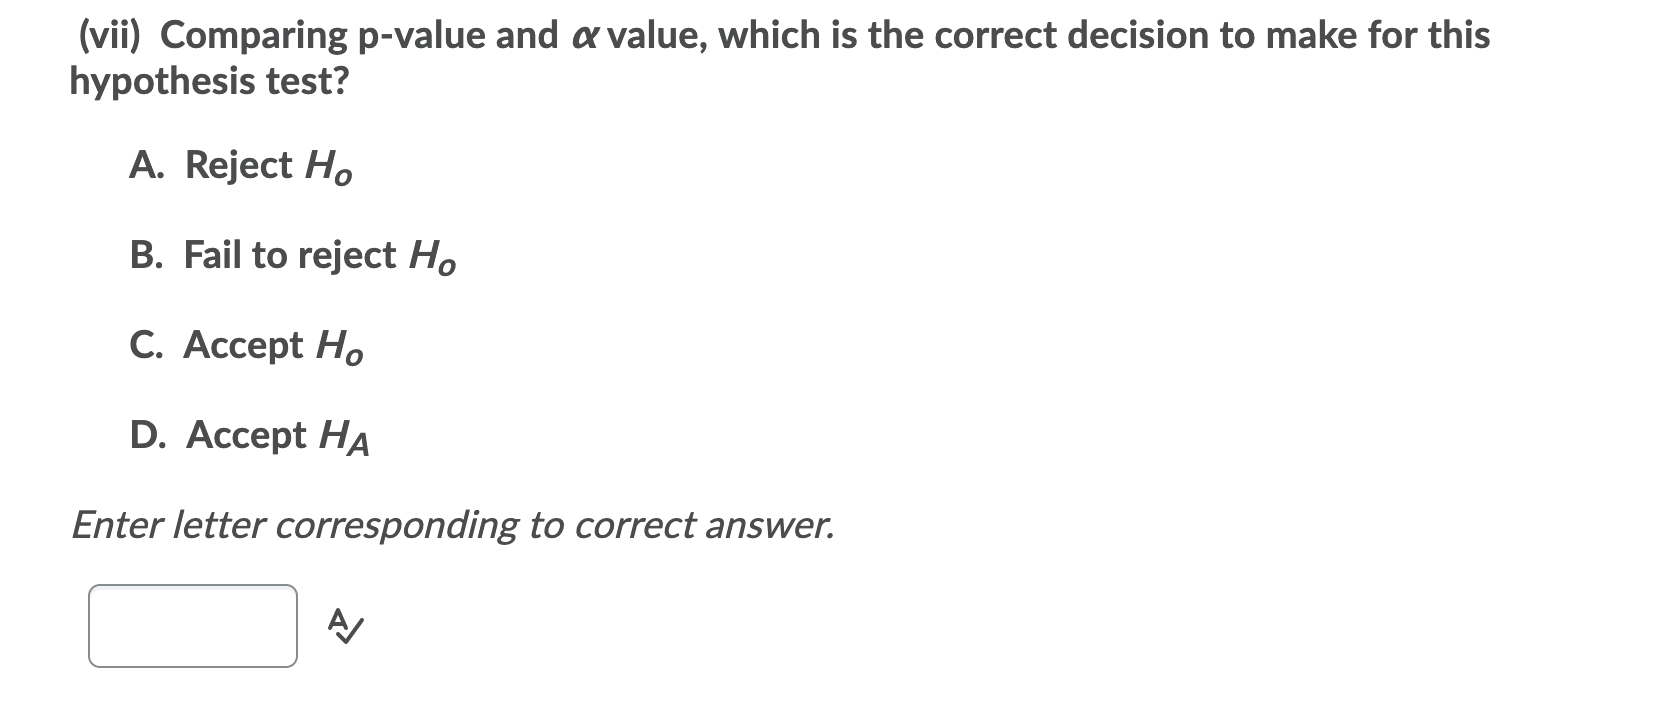
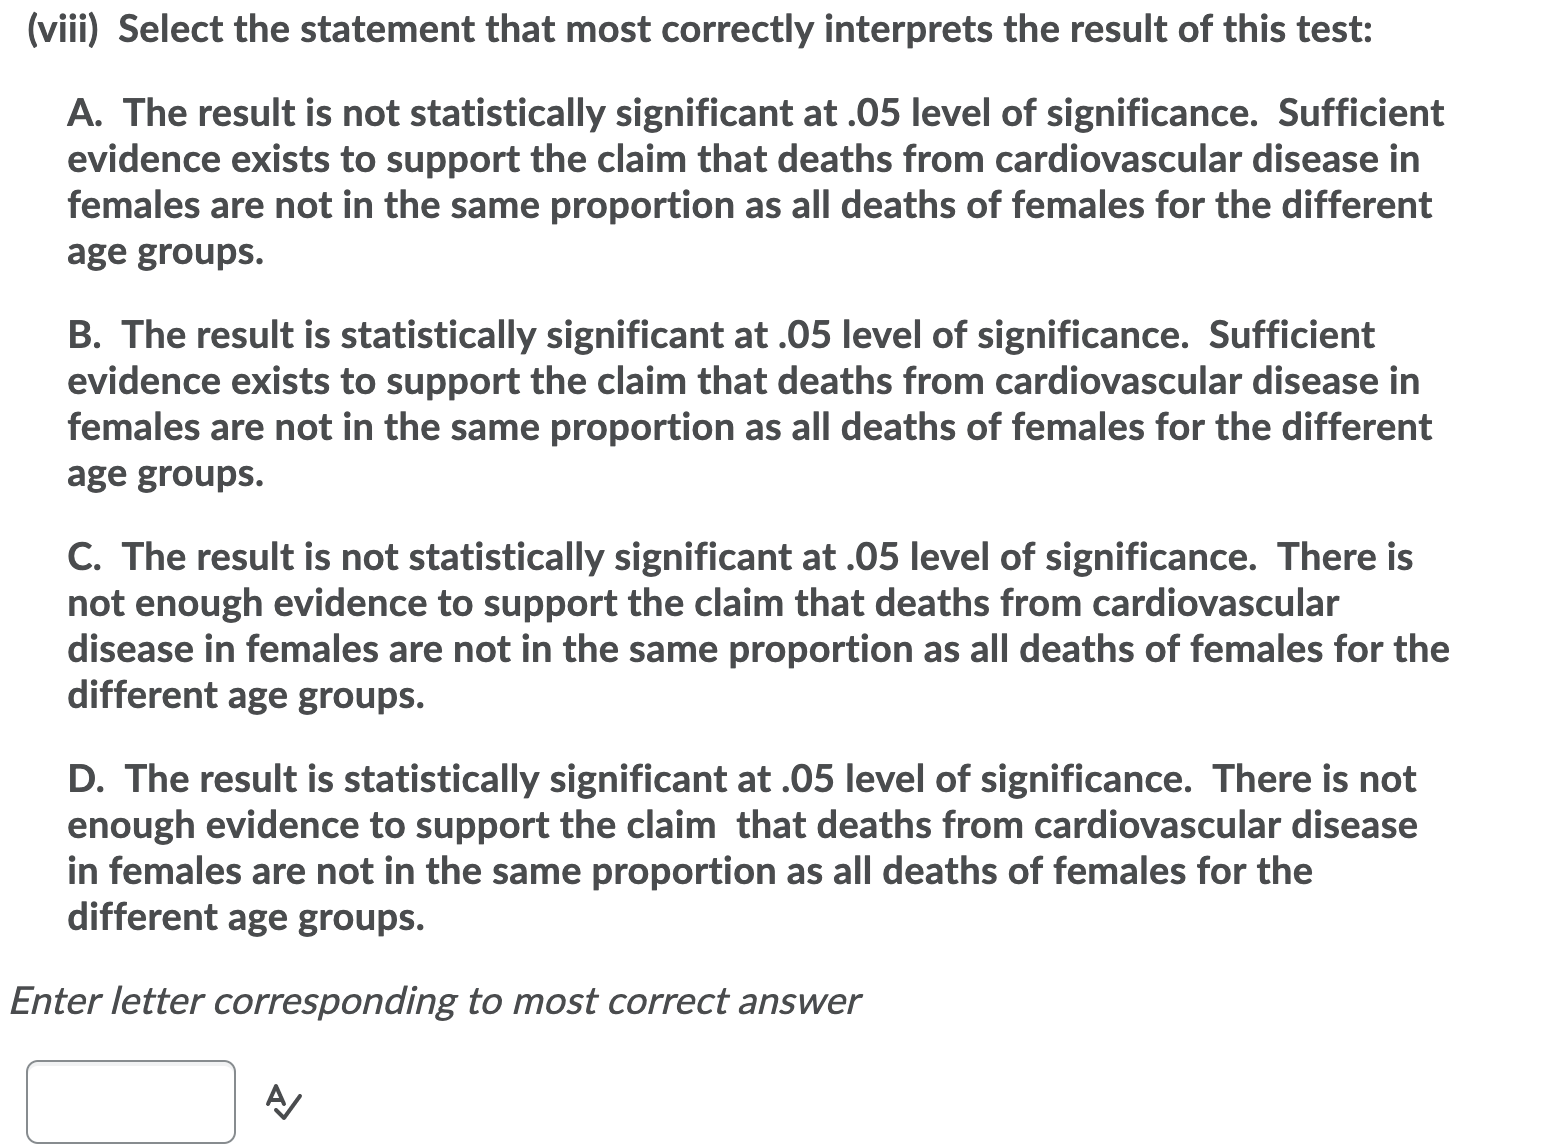
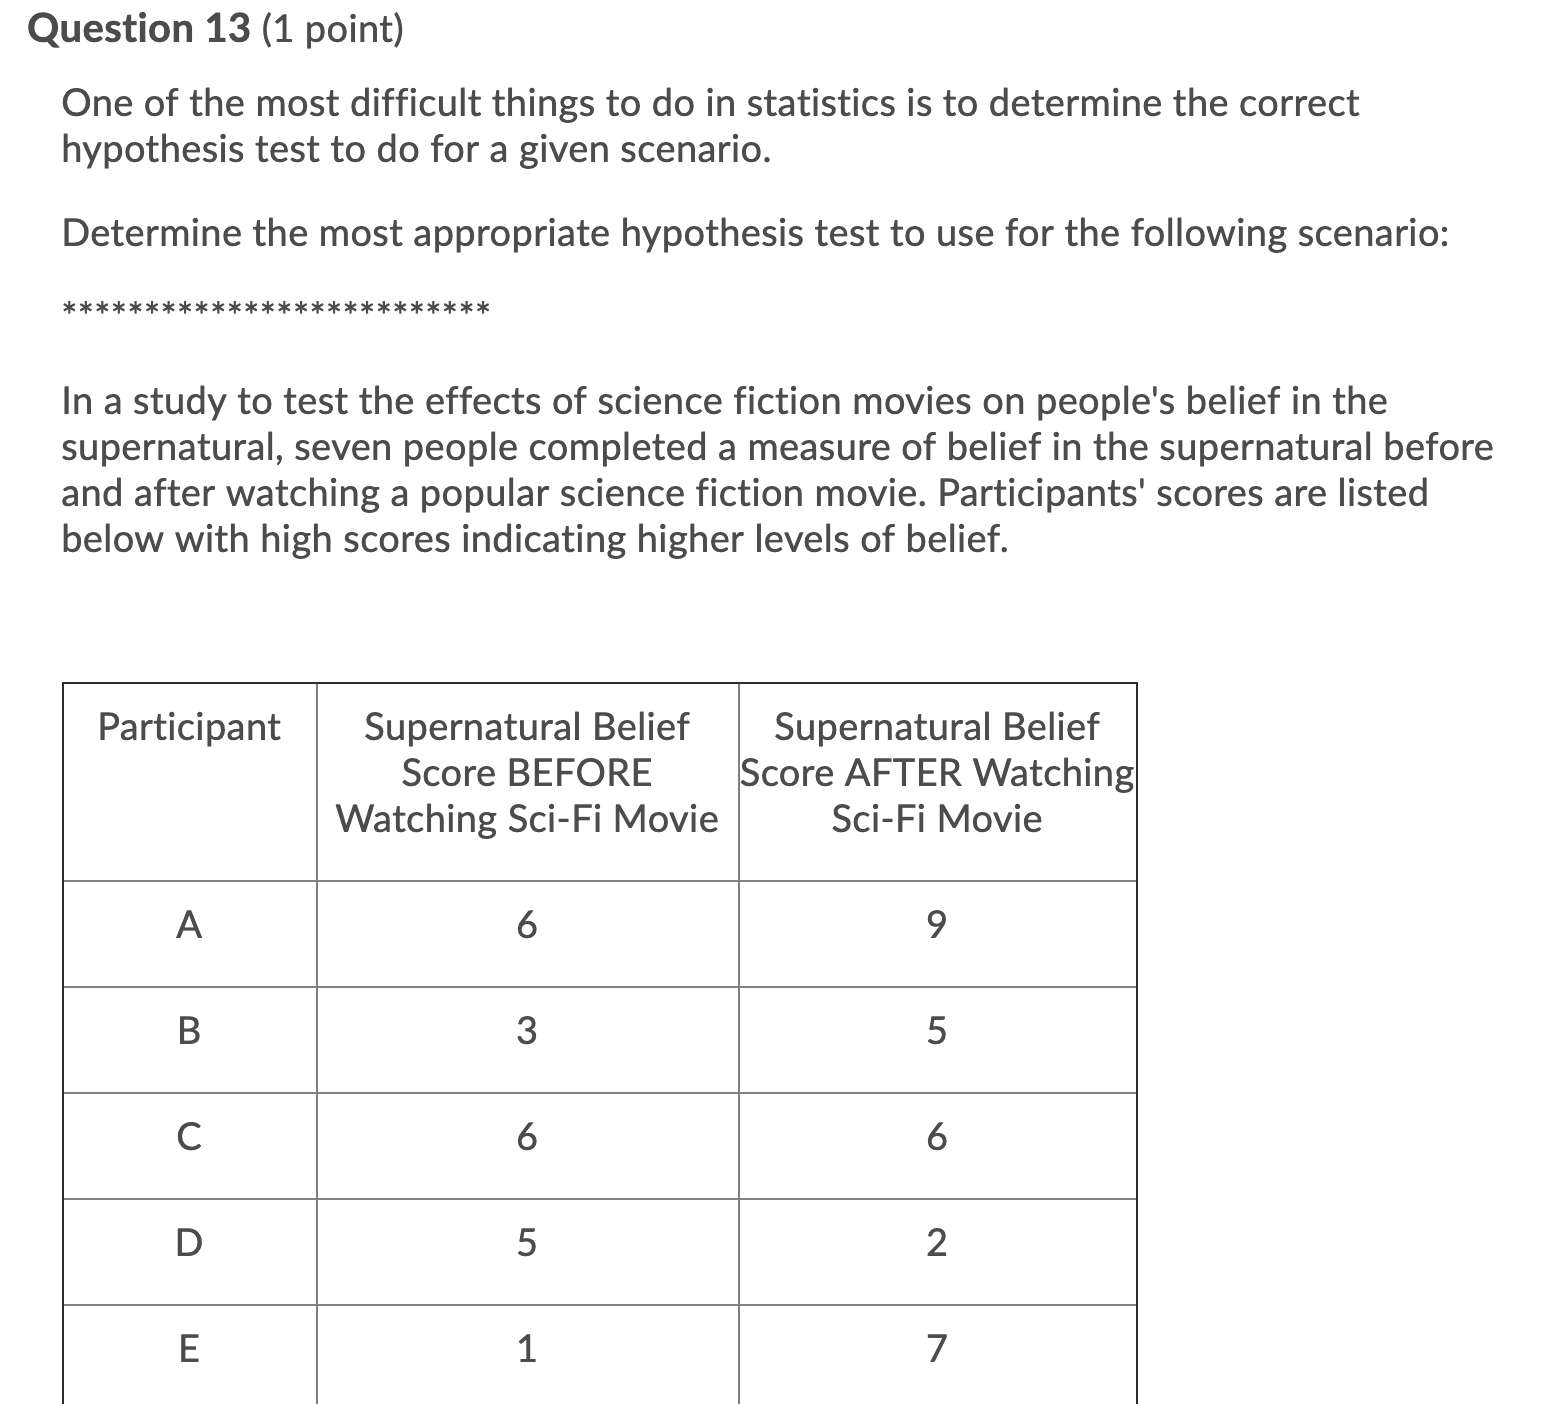
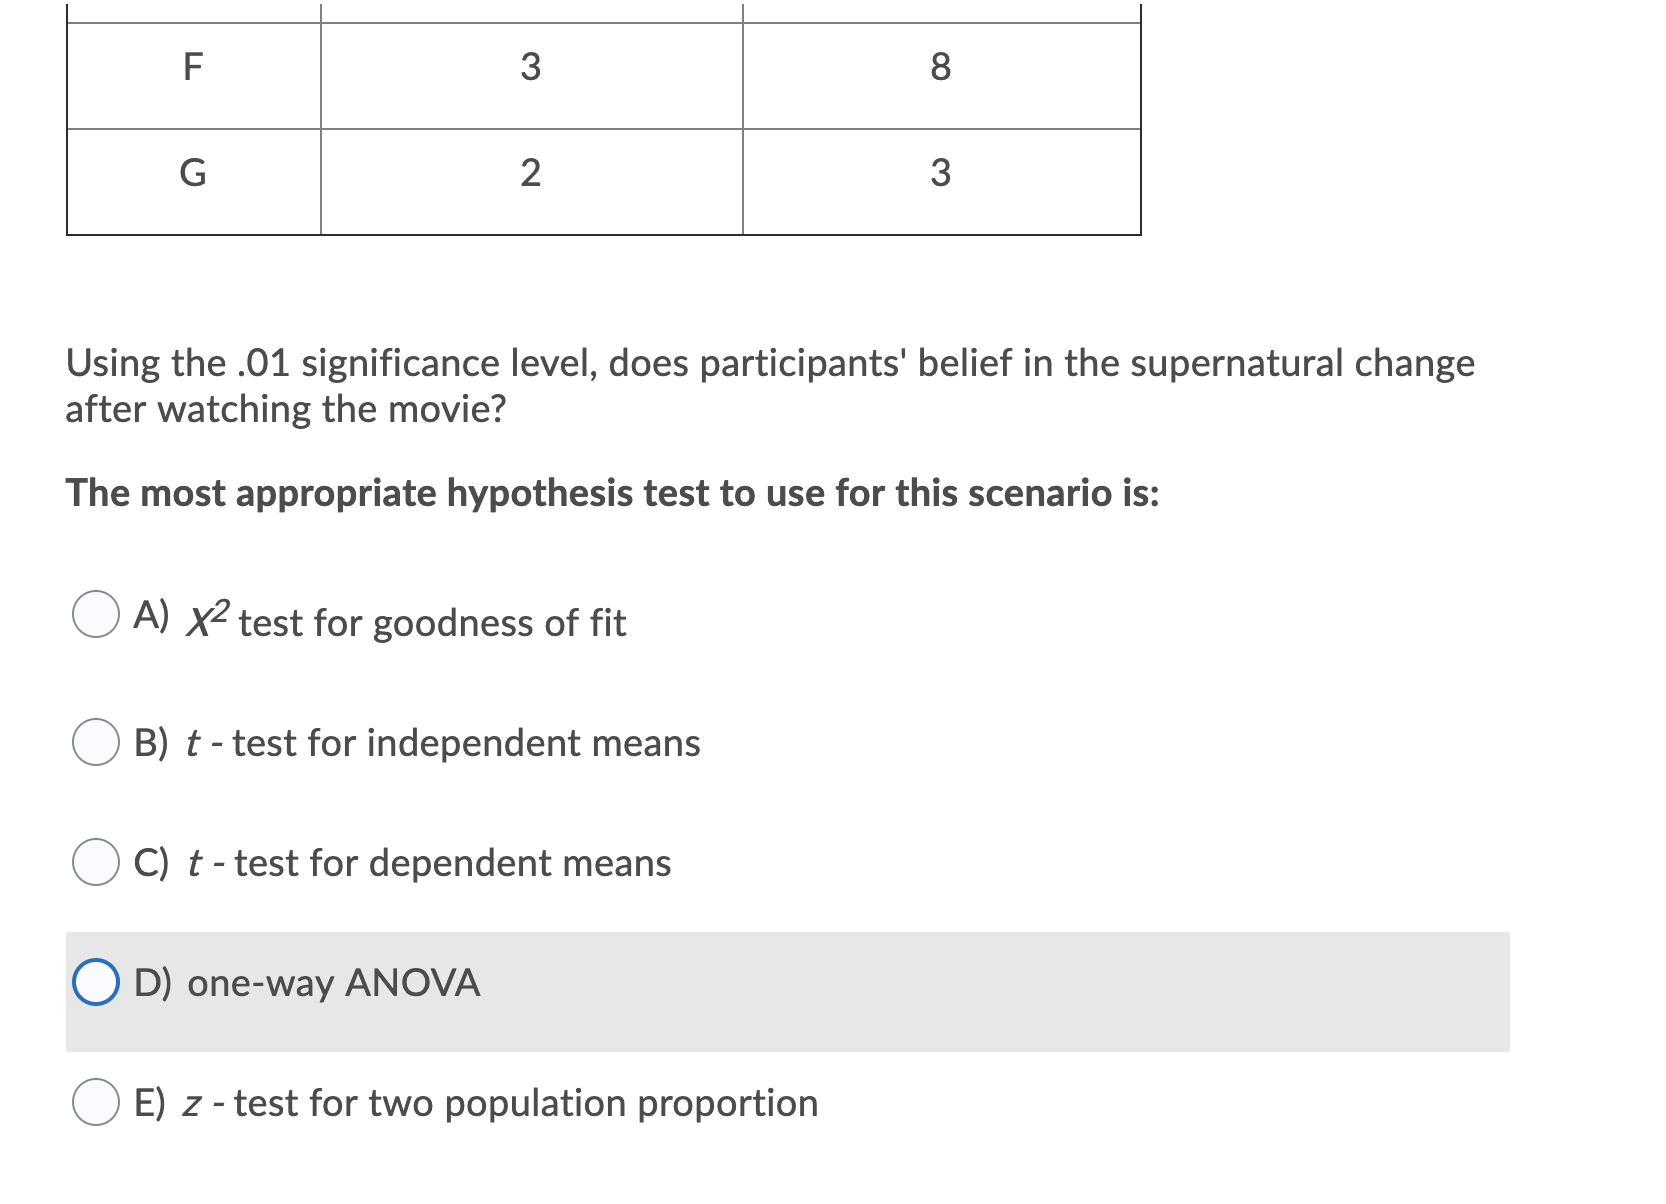
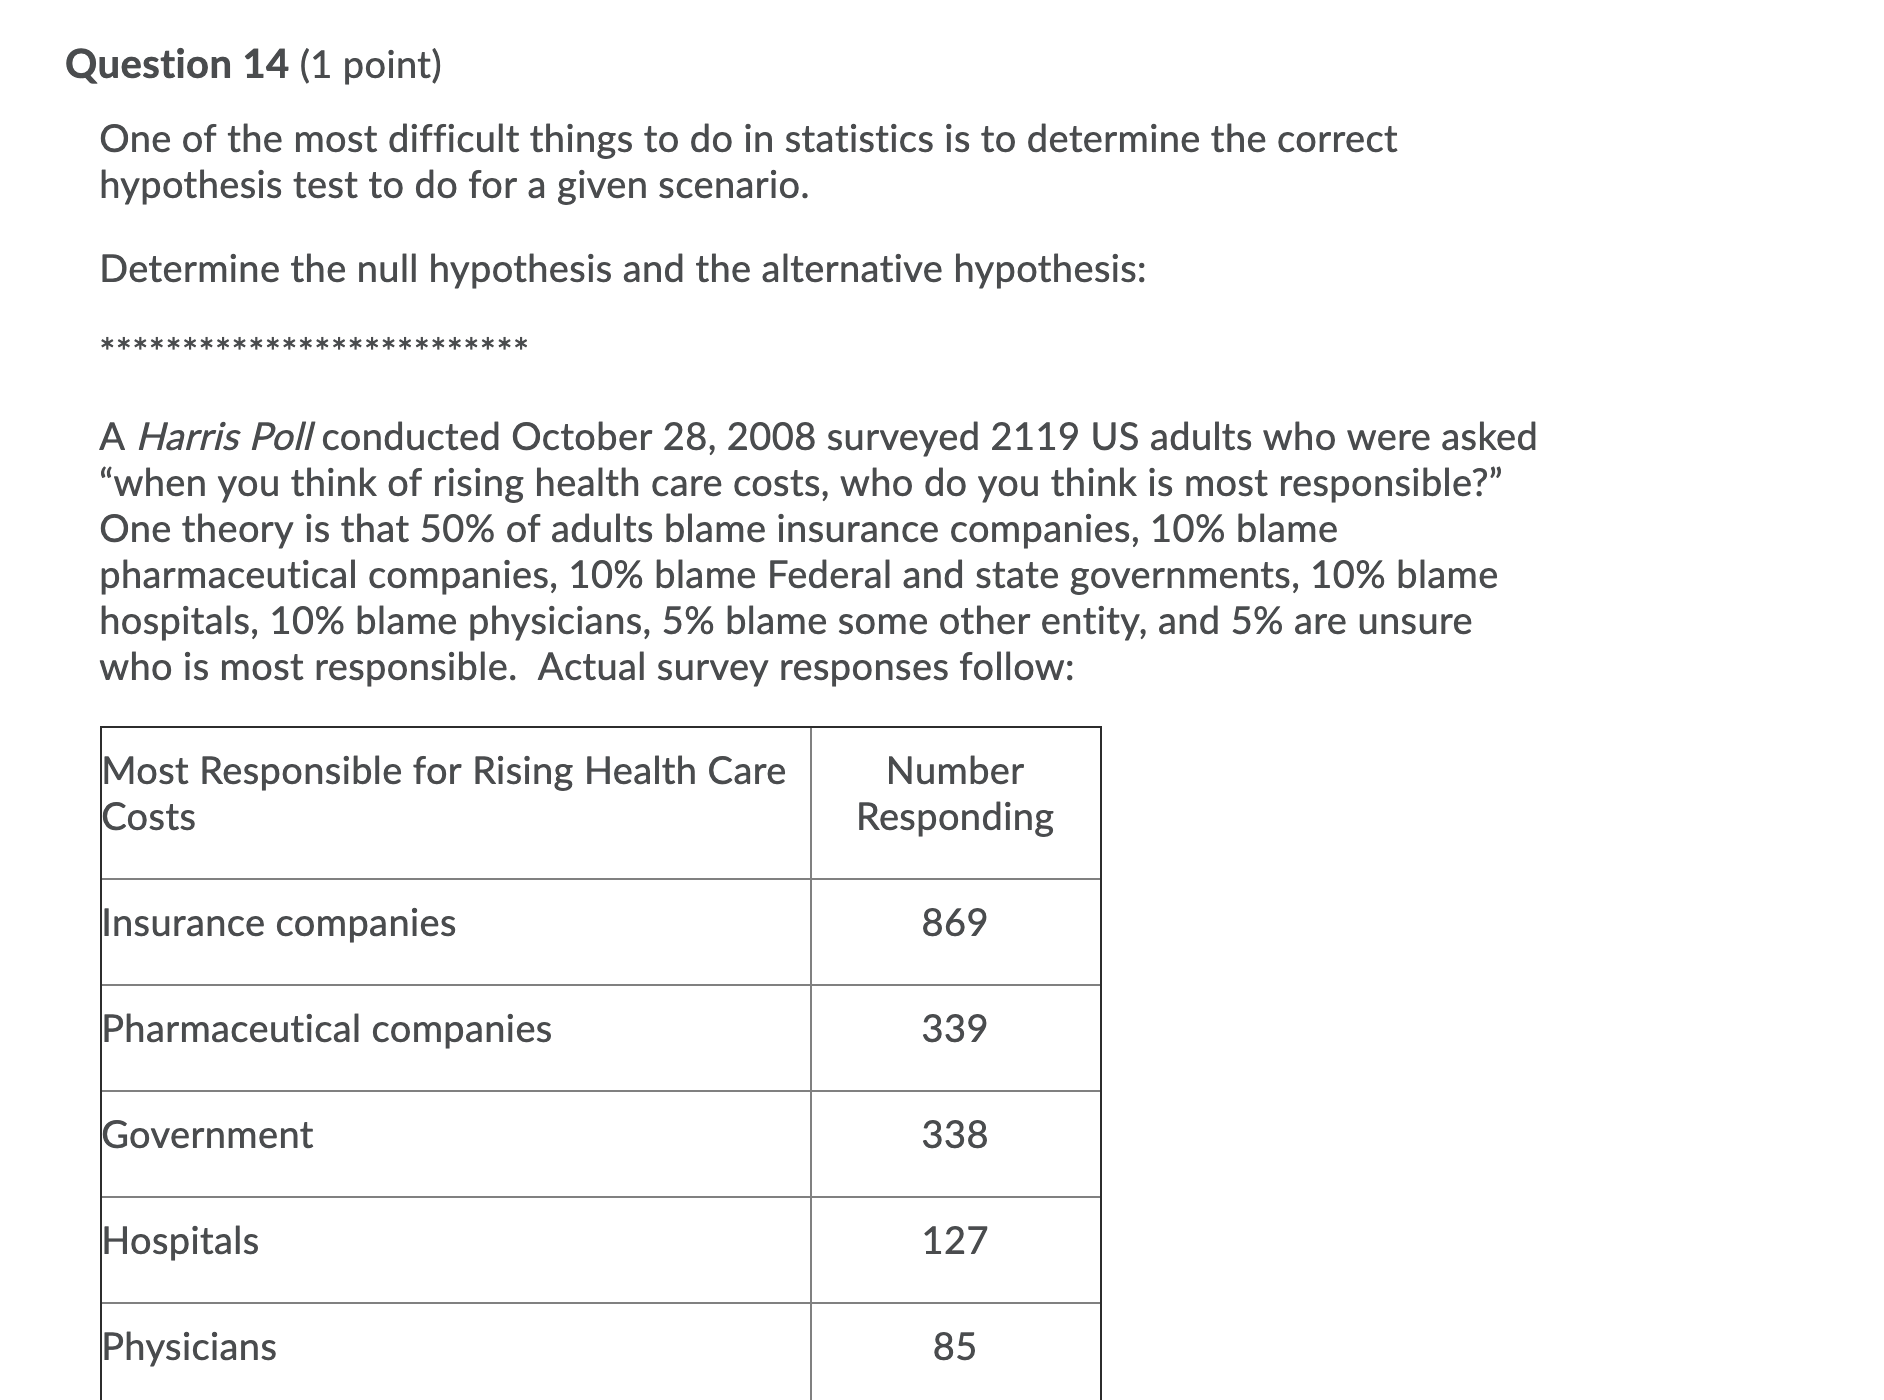
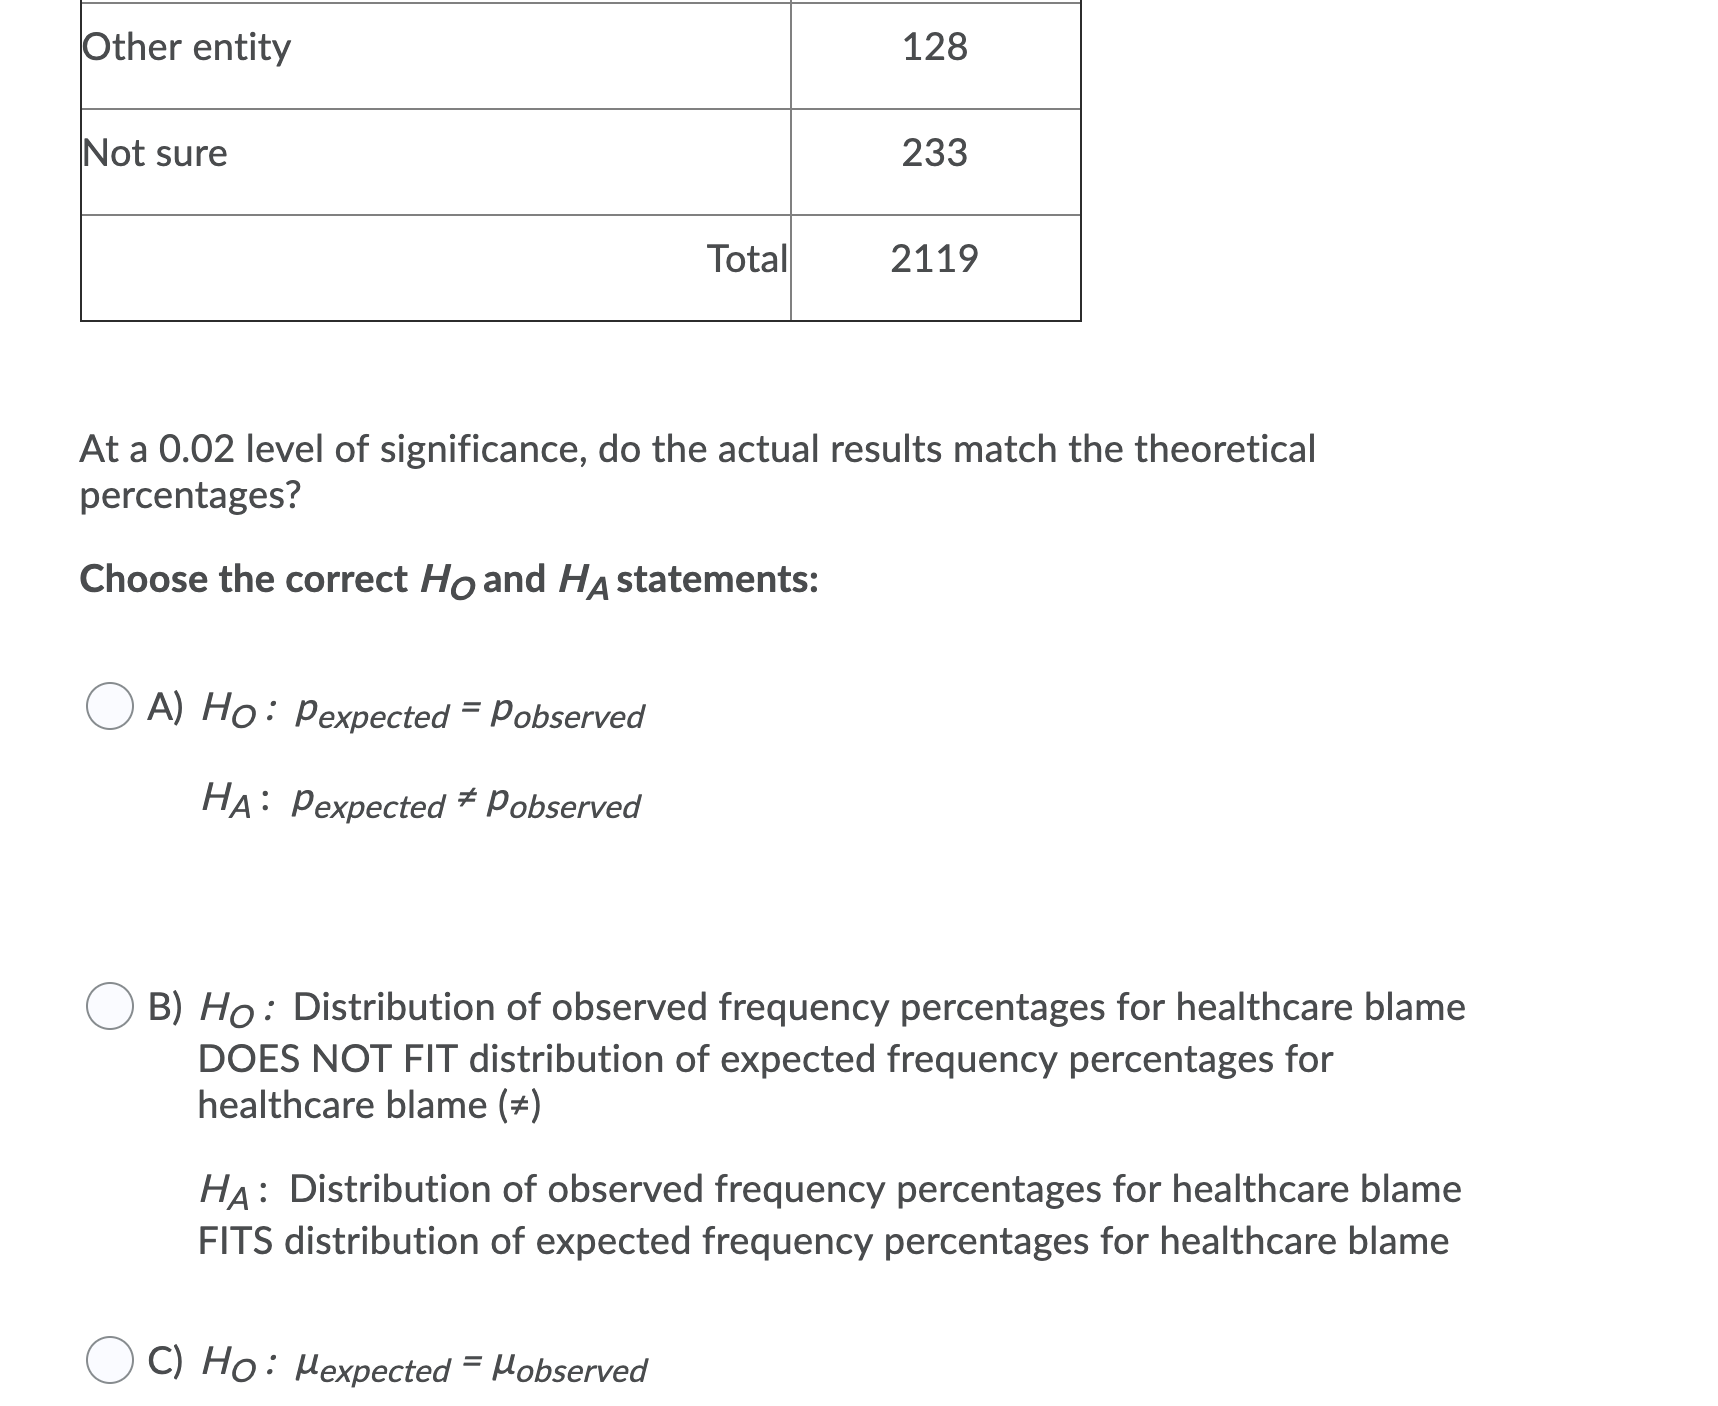
Question 11 (1 point) The World Bank collected data on the percentage of GDP that a country spends on health expenditures ("Health expenditure," 2013) and also the percentage of women receiving prenatal care ("Pregnant woman receiving," 2013). The data for the 15 countries where this information are available for the year 2011 is in the table below: Health Expenditure (% of GDP) Prenatal Care (%) 9.6 6.0 77.1 1. Determine the correlation between variables (if it exists) in this relation. Which variable is the dependent (output) variable? A. Percent of women receiving prenatal care B. Percent of gross domestic product (GDP) spent on healthcare Enter letter corresponding to correct answer S~ 2. Using technology, determine coefficient of correlation r Enter r value to nearest ten-thousandth, with its sign (no spaces). Examples of correctly entered responses: +0.7789 -0.4529 +0.9976 Correlation coefficient calculator. Correlation and Linear Regression Calculator Applet -A 3. What type of linear correlation does the calculated rvalue indicate? A. Weak negative correlation B. Weak positive correlation C. No linear correlation D. None of the above are correct Enter letter corresponding to correct answer [:6/ 4. Use the correlation coefficient rto find the coefficient of determination r2 Enter answer to nearest ten-thousandth. Examples of correctly entered responses: 0.9566 0.4070 0.5590 -~ 5. What percentage of the variability in the percentage of women receiving prenatal care is accounted for by the percentage of GDP spent on healthcare? A. 17.15% B. 97.06% C. 2.94% D. None of the above answers are correct Enter letter corresponding to correct answer [:~ Question 9 (1 point) 0383 350 300 211.8 250 200 73.7 150 33.1 Annual Rainfall, Inches 100 50 5.2 Annual rainfalls for Metropolis are given in the following table ("Annual maximums of," 2013). The box plot above provides one visual depiction of the data distribution. Use it or construct a frequency table and/or frequency histogram (use 8 classes) to analyze the distribution of this data. Then, select which of the following statements about distribution of this data is most correct: Table: Annual Rainfall in Metropolis E 139.7 200.2 171.7 187.2 184.9.- 171.5 254.3 185.9 137.2 138.9 0 A) Data appears to be distributed normally (unimodal with mean and median roughly equivalent); one outlier exists (383); no discernable skew O B) Data appears NOT to be distributed normally (unimodal but mean appears to be greater than median); one outlier exists (383); skew to right is discernable and supports relationship of mean to median (C) Data appears to be distributed normally (unimodal with mean and median roughly equivalent); no outlier exists; no discernable skew (D) Data appears NOT to be distributed normally (unimodal but mean appears to be less than median); one outlier exists (383); skew to left is discernable and supports relationship of mean to medianQuestion 12 (1 point) In Africa in 2011, the number of deaths of a female from cardiovascular disease for different age groups are in the table below ("Global health observatory," 2013). In addition, the proportion of deaths of females from all causes for the same age groups are also in table below. Table: Deaths of Females for Different Age Groups 15-29 30-49 50-69 Total Do the data show that the death from cardiovascular disease are in the same proportion as all deaths for the different age groups? Test at the 5% level. (i) Which of the following statements correctly defines the null hypothesis Ho? A. Deaths from cardiovascular disease in females are not in the same proportion as all deaths for the different age groups B. Deaths from cardiovascular disease in females are in the same proportion as all deaths for the different age groups C. neither of these statements is correct for Ho Enter letter corresponding to correct answer [26/ (ii) Which of the following statements correctly defines the alternative hypothesis HA? A. Deaths from cardiovascular disease in females are in the same proportion as all deaths for the different age groups B. Deaths from cardiovascular disease in females are not in the same proportion as all deaths for the different age groups C. neither of these statements is correct for HA Enter letter corresponding to correct answer CM (iii) Enter the level of significance a used for this test: Enter in decimal form. Examples of correctly entered answers: 0.01 0.02 0.05 0.10 :M (iv) Are any of the gpected frequency values (for which H0 is true) for any cell in your table less than 5? Calculate the expected frequencies using technology, the select most correct answer: A. yes - this will not affect results of hypothesis test B. yes - this may invalidate results of hypothesis test C. no - this will not affect results of hypothesis test D. no - this may invalidate results of hypothesis test Enter letter corresponding to correct answer. Recommend using (Chi-Square Goodness-of-Fit Applet) to create contingency table of expected and observed frequency values in order to answer this question. BE SURE when entering expected frequency data you select what format you're entering the data ("percent expected", "fraction expected" which includes decimal, or "actual number expected"). S (v) Using calculator, spreadsheet, or online calculator, determine test statistic: Enter value in decimal form rounded to nearest thousandth. Examples of correctly entered answers: 2.010 0.307 1.600 11.019 Recommended online calculator: Chi-Square Goodness-of-Fit Applet BE SURE when entering expected frequency data you select what format you're entering the data ("percent expected", "fraction expected" which includes decimal, or "actual number expected"). -,, (vi) Using tables, calculator, or spreadsheet: Determine and enter p-value corresponding to test statistic. Enter value in decimal form rounded to nearest ten-thousandth. Examples of correctly entered answers: 0.0001 0.0021 0.0305 0.6004 0.8143 1.0000 Recommended online calculator: Chi-Square Goodness-of-Fit Applet BE SURE when entering expected frequency data you select what format you're entering the data ("percent expected", "fraction expected" which includes decimal, or "actual number expected"). 6/ (vii) Comparing p-value and or value, which is the correct decision to make for this hypothesis test? A. Reject Ho B. Fail to reject Ho C. Accept Ho D. Accept HA Enter letter corresponding to correct answer.(viii) Select the statement that most correctly interprets the result of this test: A. The result is not statistically significant at .05 level of significance. Sufficient evidence exists to support the claim that deaths from cardiovascular disease in females are not in the same proportion as all deaths of females for the different age groups. B. The result is statistically significant at .05 level of significance. Sufficient evidence exists to support the claim that deaths from cardiovascular disease in females are not in the same proportion as all deaths of females for the different age groups. C. The result is not statistically significant at .05 level of significance. There is not enough evidence to support the claim that deaths from cardiovascular disease in females are not in the same proportion as all deaths of females for the different age groups. D. The result is statistically significant at .05 level of significance. There is not enough evidence to support the claim that deaths from cardiovascular disease in females are not in the same proportion as all deaths of females for the different age groups. Enter letter corresponding to most correct answer CW Question 13 (1 point) One of the most difficult things to do in statistics is to determine the correct hypothesis test to do for a given scenario. Determine the most appropriate hypothesis test to use for the following scenario: ************************** In a study to test the effects of science fiction movies on people's belief in the supernatural, seven people completed a measure of belief in the supernatural before and after watching a popular science fiction movie. Participants' scores are listed below with high scores indicating higher levels of belief. PartiCIpant Supernatural Belief Supernatural Belief Score BEFORE Score AFTER Watching Watching Sci-Fi Movie Sci-Fi Movie E 1 7 Using the .01 significance level, does participants' belief in the supernatural change after watching the movie? The most appropriate hypothesis test to use for this scenario is: O A) X2 test for goodness of fit 0 B) t test for independent means 0 C) t - test for dependent means 0 D) one-way ANOVA O E) z - test for two population proportion Question 14 (1 point) One of the most difficult things to do in statistics is to determine the correct hypothesis test to do for a given scenario. Determine the null hypothesis and the alternative hypothesis: \"no:*********************** A Harris Poll conducted October 28, 2008 surveyed 2119 US adults who were asked "when you think of rising health care costs, who do you think is most responsible?" One theory is that 50% of adults blame insurance companies, 10% blame pharmaceutical companies, 10% blame Federal and state governments, 10% blame hospitals, 10% blame physicians, 5% blame some other entity, and 5% are unsure who is most responsible. Actual survey responses follow: Most Responsible for Rising Health Care Number Costs Responding Insurance companies 869 Pharmaceutical companies 339 Government 338 Hospitals 127 Physicians 85 Other entity 128 Not sure 233 Total 2119 At a 0.02 level of significance, do the actual results match the theoretical percentages? Choose the correct Ho and HA statements: ( A) Ho: Pexpected = Pobserved HA : Pexpected * Pobserved (B) Ho: Distribution of observed frequency percentages for healthcare blame DOES NOT FIT distribution of expected frequency percentages for healthcare blame (#) HA : Distribution of observed frequency percentages for healthcare blame FITS distribution of expected frequency percentages for healthcare blame O C) Ho: Mexpected = MobservedO D) HO : Distribution of observed frequency percentages for healthcare blame FITS distribution of expected frequency percentages for healthcare blame HA : Distribution of observed frequency percentages for healthcare blame DOES NOT FIT distribution of expected frequency percentages for healthcare blame (at)
