Answered step by step
Verified Expert Solution
Question
1 Approved Answer
please help me to code this i have to submit in 2 hours and am unable to do it We want to model the fields
please help me to code this
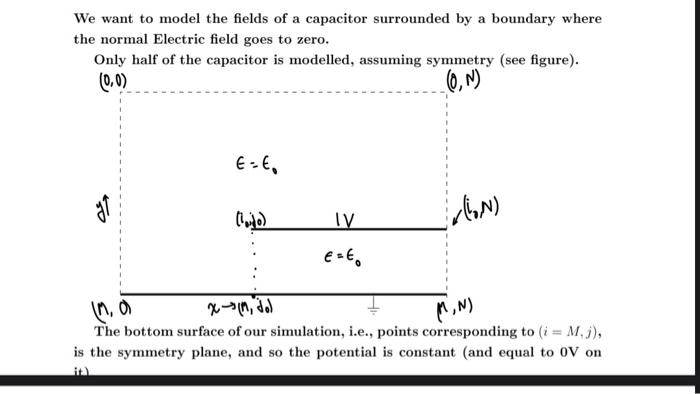
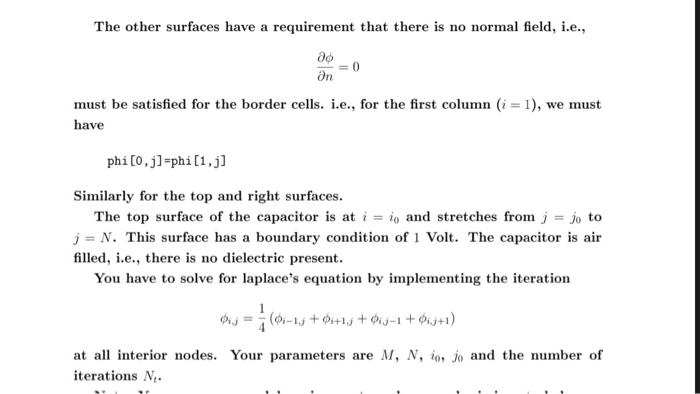
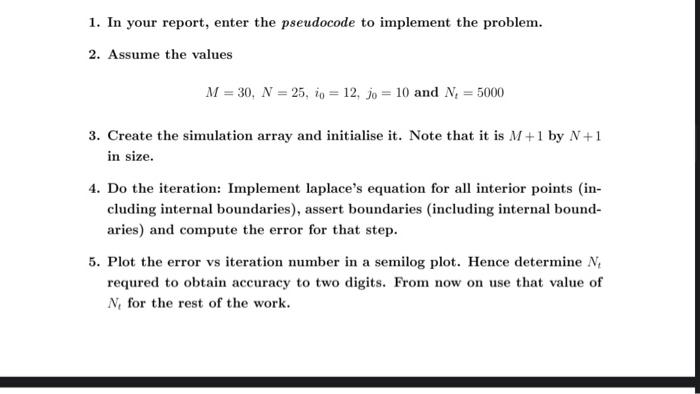
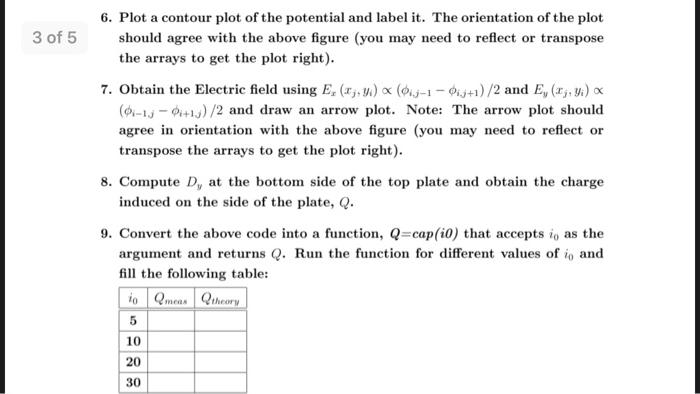
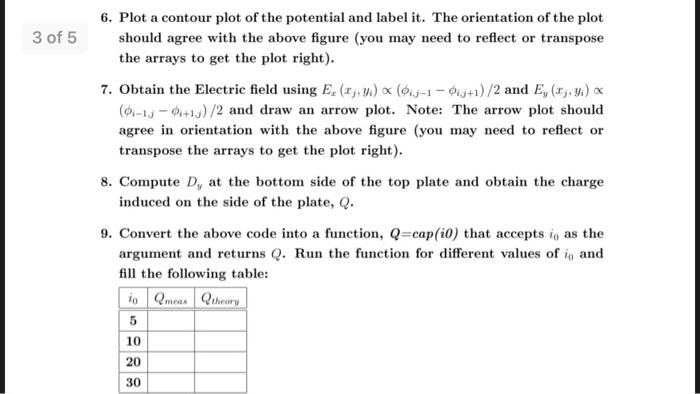
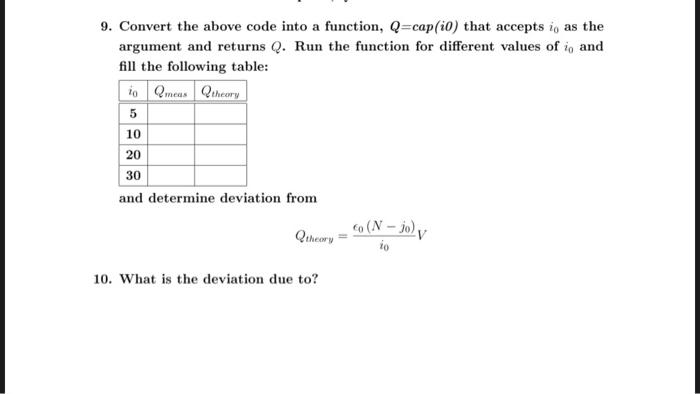
We want to model the fields of a capacitor surrounded by a boundary where the normal Electric field goes to zero. Only half of the capacitor is modelled, assuming symmetry (see figure). (0,0) 0,N) ELE, it) vlon) IV E = ino x-1, .) MiN) The bottom surface of our simulation, i.e., points corresponding to (i = M.;), is the symmetry plane, and so the potential is constant (and equal to OV on The other surfaces have a requirement that there is no normal field, i.e., ao = 0 n must be satisfied for the border cells. i.e., for the first column (i = 1), we must have phi [0,j]=phi [i,j] Similarly for the top and right surfaces. The top surface of the capacitor is at i = in and stretches from j = jo to j = N. This surface has a boundary condition of 1 Volt. The capacitor is air filled, i.e., there is no dielectric present. You have to solve for laplace's equation by implementing the iteration Die = (0-1) +01+1) +-1 +is+1) at all interior nodes. Your parameters are M, N, 10, jo and the number of iterations N. 1. In your report, enter the pseudocode to implement the problem. 2. Assume the values M=30, N = 25, 10 = 12, jo = 10 and N, = 5000 3. Create the simulation array and initialise it. Note that it is M+1 by N+1 in size. 4. Do the iteration: Implement laplace's equation for all interior points (in- cluding internal boundaries), assert boundaries (including internal bound- aries) and compute the error for that step. 5. Plot the error vs iteration number in a semilog plot. Hence determine N, requred to obtain accuracy to two digits. From now on use that value of N, for the rest of the work. 3 of 5 6. Plot a contour plot of the potential and label it. The orientation of the plot should agree with the above figure (you may need to reflect or transpose the arrays to get the plot right). 7. Obtain the Electric field using E. (3).W) (3-1 - 3+1)/2 and E, (2;.) x (01-13 - +1)/2 and draw an arrow plot. Note: The arrow plot should agree in orientation with the above figure (you may need to reflect or transpose the arrays to get the plot right). 8. Compute D, at the bottom side of the top plate and obtain the charge induced on the side of the plate, Q. 9. Convert the above code into a function, Q=cap(i) that accepts i, as the argument and returns Q. Run the function for different values of i, and fill the following table: 10 Qmous Qtheory 5 10 20 30 3 of 5 6. Plot a contour plot of the potential and label it. The orientation of the plot should agree with the above figure (you may need to reflect or transpose the arrays to get the plot right). 7. Obtain the Electric field using E. (03W) (0-1 - 01s+1)/2 and E, (X,Y) (01-13 - +1)/2 and draw an arrow plot. Note: The arrow plot should agree in orientation with the above figure (you may need to reflect or transpose the arrays to get the plot right). 8. Compute D, at the bottom side of the top plate and obtain the charge induced on the side of the plate, Q. 9. Convert the above code into a function, Q=cap(io) that accepts i, as the argument and returns Q. Run the function for different values of i, and fill the following table: 10 Qmous Qrheory 10 20 30 9. Convert the above code into a function, Q=cap(io) that accepts to as the argument and returns Q. Run the function for different values of , and fill the following table: to meus theory 5 10 20 30 and determine deviation from Qtheory co (N-jo) y 10. What is the deviation due to? We want to model the fields of a capacitor surrounded by a boundary where the normal Electric field goes to zero. Only half of the capacitor is modelled, assuming symmetry (see figure). (0,0) 0,N) ELE, it) vlon) IV E = ino x-1, .) MiN) The bottom surface of our simulation, i.e., points corresponding to (i = M.;), is the symmetry plane, and so the potential is constant (and equal to OV on The other surfaces have a requirement that there is no normal field, i.e., ao = 0 n must be satisfied for the border cells. i.e., for the first column (i = 1), we must have phi [0,j]=phi [i,j] Similarly for the top and right surfaces. The top surface of the capacitor is at i = in and stretches from j = jo to j = N. This surface has a boundary condition of 1 Volt. The capacitor is air filled, i.e., there is no dielectric present. You have to solve for laplace's equation by implementing the iteration Die = (0-1) +01+1) +-1 +is+1) at all interior nodes. Your parameters are M, N, 10, jo and the number of iterations N. 1. In your report, enter the pseudocode to implement the problem. 2. Assume the values M=30, N = 25, 10 = 12, jo = 10 and N, = 5000 3. Create the simulation array and initialise it. Note that it is M+1 by N+1 in size. 4. Do the iteration: Implement laplace's equation for all interior points (in- cluding internal boundaries), assert boundaries (including internal bound- aries) and compute the error for that step. 5. Plot the error vs iteration number in a semilog plot. Hence determine N, requred to obtain accuracy to two digits. From now on use that value of N, for the rest of the work. 3 of 5 6. Plot a contour plot of the potential and label it. The orientation of the plot should agree with the above figure (you may need to reflect or transpose the arrays to get the plot right). 7. Obtain the Electric field using E. (3).W) (3-1 - 3+1)/2 and E, (2;.) x (01-13 - +1)/2 and draw an arrow plot. Note: The arrow plot should agree in orientation with the above figure (you may need to reflect or transpose the arrays to get the plot right). 8. Compute D, at the bottom side of the top plate and obtain the charge induced on the side of the plate, Q. 9. Convert the above code into a function, Q=cap(i) that accepts i, as the argument and returns Q. Run the function for different values of i, and fill the following table: 10 Qmous Qtheory 5 10 20 30 3 of 5 6. Plot a contour plot of the potential and label it. The orientation of the plot should agree with the above figure (you may need to reflect or transpose the arrays to get the plot right). 7. Obtain the Electric field using E. (03W) (0-1 - 01s+1)/2 and E, (X,Y) (01-13 - +1)/2 and draw an arrow plot. Note: The arrow plot should agree in orientation with the above figure (you may need to reflect or transpose the arrays to get the plot right). 8. Compute D, at the bottom side of the top plate and obtain the charge induced on the side of the plate, Q. 9. Convert the above code into a function, Q=cap(io) that accepts i, as the argument and returns Q. Run the function for different values of i, and fill the following table: 10 Qmous Qrheory 10 20 30 9. Convert the above code into a function, Q=cap(io) that accepts to as the argument and returns Q. Run the function for different values of , and fill the following table: to meus theory 5 10 20 30 and determine deviation from Qtheory co (N-jo) y 10. What is the deviation due to i have to submit in 2 hours and am unable to do it
Step by Step Solution
There are 3 Steps involved in it
Step: 1

Get Instant Access to Expert-Tailored Solutions
See step-by-step solutions with expert insights and AI powered tools for academic success
Step: 2

Step: 3

Ace Your Homework with AI
Get the answers you need in no time with our AI-driven, step-by-step assistance
Get Started


