Answered step by step
Verified Expert Solution
Link Copied!

Question

1 Approved Answer

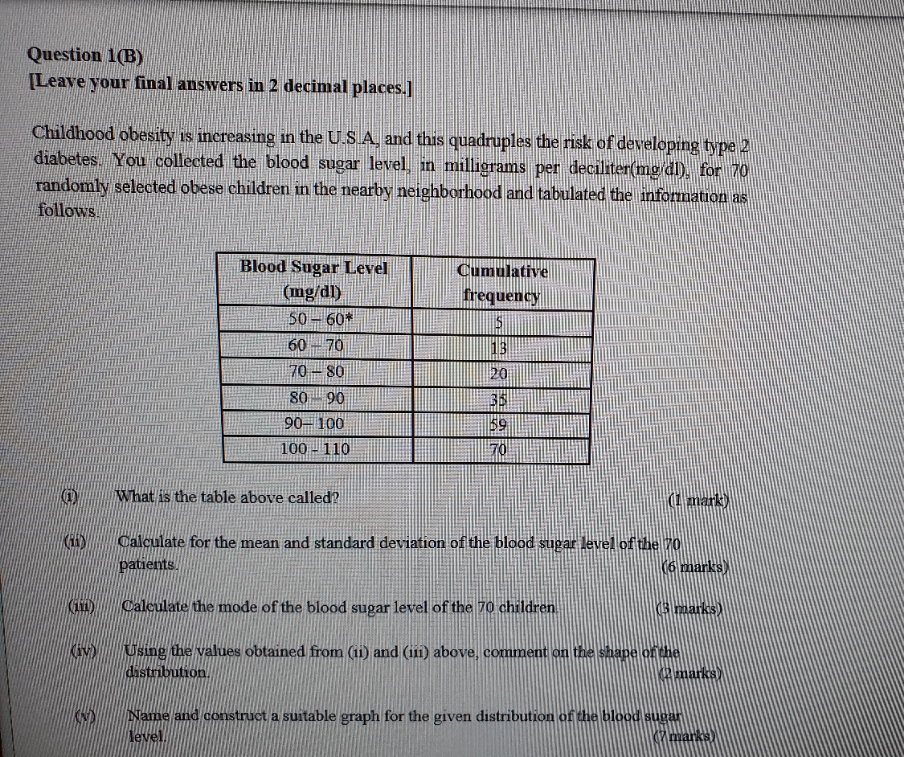
please help me to solve these questions. Question 1(B) [Leave your final answers in 2 decimal places.] Childhood obesity is increasing in the U.S A,

please help me to solve these questions.

image text in transcribed
Question 1(B) [Leave your final answers in 2 decimal places.] Childhood obesity is increasing in the U.S A, and this quadruples the risk of developing type 2 diabetes. You collected the blood sugar level, in milligrams per deciliter(mg dl), for 70 randomly selected obese children in the nearby neighborhood and tabulated the information as follows. Blood Sugar Level Cumulative (mg/dl) frequency 50 - 60+ 60 - 70 13 70 - 80 20 80 90 36 90- 100 159 100 -110 70 What is the table above called? (I mark) Calculate for the mean and standard deviation of the blood sugar level of the 70 patients. (6 marks) Calculate the mode of the blood sugar level of the 70 children (B marks) Using the values obtained from (ii) and (ili) above, comment on the shape of the distribution. (R marks) Name and construct a suitable graph for the given distribution of the blood sugar level mark's

Step by Step Solution

There are 3 Steps involved in it

Step: 1

blur-text-image

Get Instant Access to Expert-Tailored Solutions

See step-by-step solutions with expert insights and AI powered tools for academic success

Step: 2

blur-text-image

Step: 3

blur-text-image

Ace Your Homework with AI

Get the answers you need in no time with our AI-driven, step-by-step assistance

Get Started

Recommended Textbook for

Finite Math And Applied Calculus

Authors: Stefan Waner, Steven Costenoble

6th Edition

1285415132, 9781285415130

More Books

Students also viewed these Mathematics questions