Please help me with The mean and The Deviation for question 5.1.21. The rest of the questions are listed in the pictures, note that question for the picture 10. 1. 15T is all the way in the bottom of the second picture and that is only question I need help with from the question 10. 1. 15T The rest has been answered. Most of the questions has being answered I just need help with the ones that are empty.
.
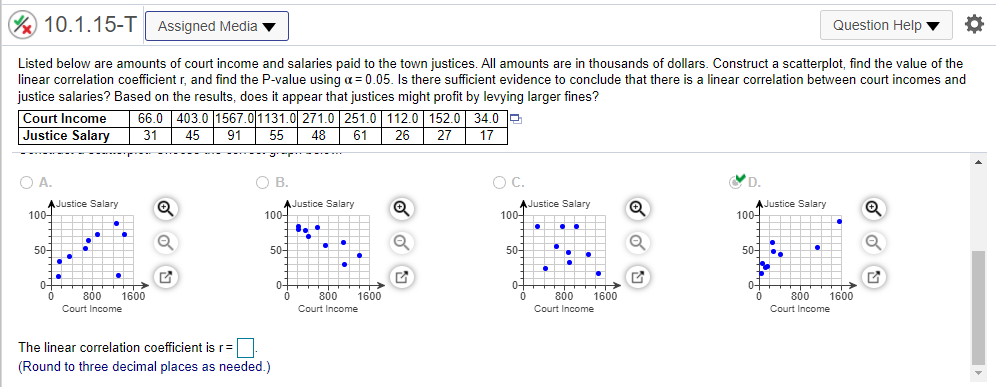
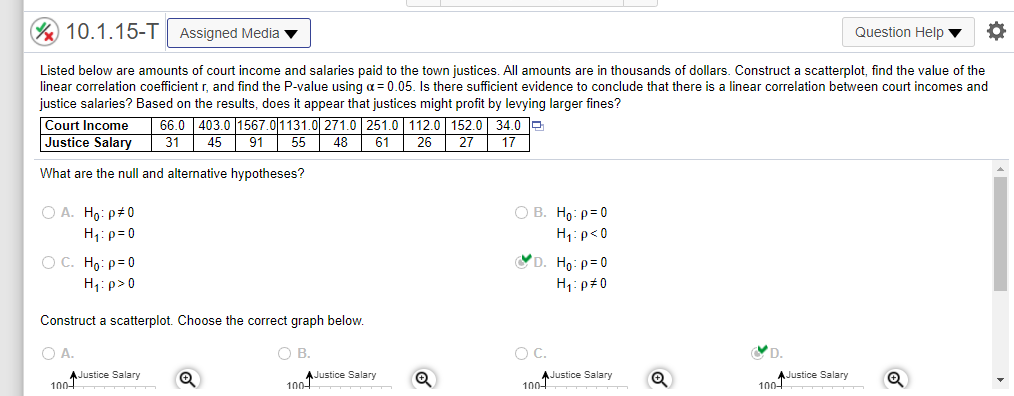
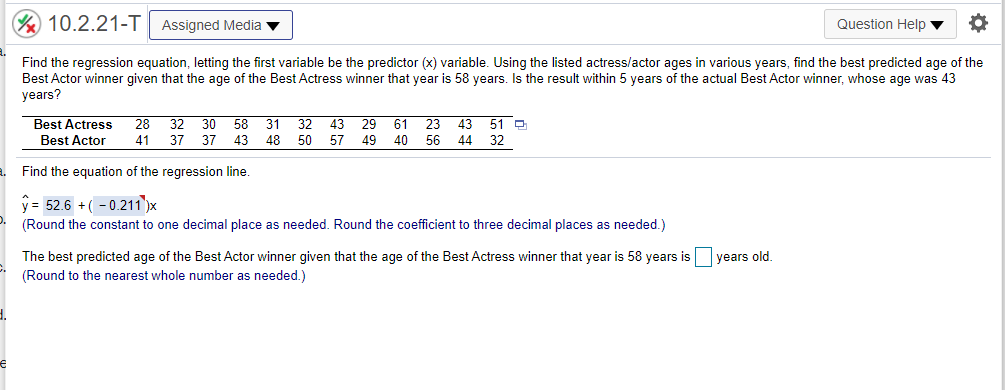
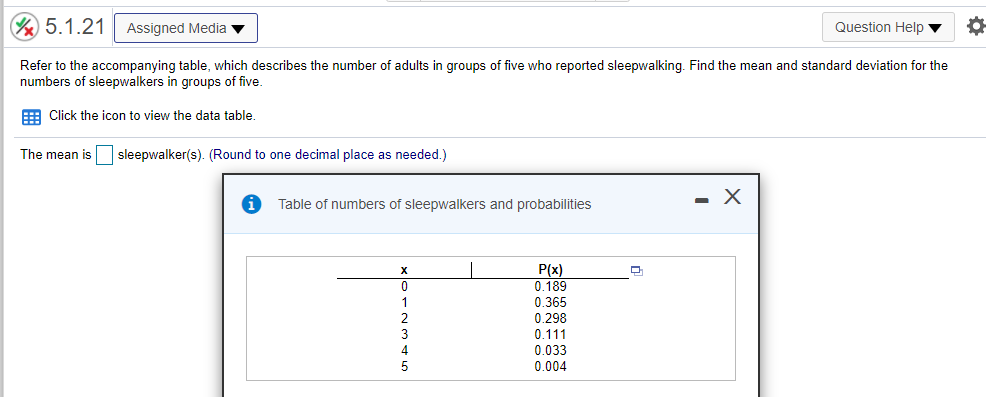
10.1. 15-T Assigned Media Question Help Listed below are amounts of court income and salaries paid to the town justices. All amounts are in thousands of dollars. Construct a scatterplot, find the value of the linear correlation coefficient r, and find the P-value using a= 0.05. Is there sufficient evidence to conclude that there is a linear correlation between court incomes and justice salaries? Based on the results, does it appear that justices might profit by levying larger fines? Court Income 66.0 403.0 1567.0 1131.0 271.0 251.0 112.0 152.0 34.0 Justice Salary 31 45 91 55 48 61 26 27 17 O A. O B. O C. D. A Justice Salary A Justice Salary ^ Justice Salary A Justice Salary 100- 100- 100- 100- 50- 50- 50- 50- 800 1600 800 1600 800 1600 800 1600 Court Income Court Income Court Income Court Income The linear correlation coefficient is r=. (Round to three decimal places as needed.)10.1.15-T Assigned Media Question Help Listed below are amounts of court income and salaries paid to the town justices. All amounts are in thousands of dollars. Construct a scatterplot, find the value of the linear correlation coefficient r, and find the P-value using o = 0.05. Is there sufficient evidence to conclude that there is a linear correlation between court incomes and justice salaries? Based on the results, does it appear that justices might profit by levying larger fines? Court Income 66.0 403.0 1567.0 1131.0 271.0 251.0 112.0 152.0 34.0 Justice Salary 31 45 91 55 48 61 26 27 17 What are the null and alternative hypotheses? O A. Ho: p#0 OB. Ho: p = 0 Hy : p = 0 H1: p 0 H1: p#0 Construct a scatterplot. Choose the correct graph below. O A. O B. O C. CD. A Justice Salary A Justice Salary 100- A Justice Salary 100- A Justice Salary 100- 100-10.2.21-T Assigned Media Question Help Find the regression equation, letting the first variable be the predictor (x) variable. Using the listed actress/actor ages in various years, find the best predicted age of the Best Actor winner given that the age of the Best Actress winner that year is 58 years. Is the result within 5 years of the actual Best Actor winner, whose age was 43 years? Best Actress 28 32 30 58 31 32 43 29 61 23 43 51 0 Best Actor 41 37 37 43 48 50 57 49 40 56 44 32 Find the equation of the regression line. y = 52.6 + ( -0.211 )x (Round the constant to one decimal place as needed. Round the coefficient to three decimal places as needed.) The best predicted age of the Best Actor winner given that the age of the Best Actress winner that year is 58 years is | years old. (Round to the nearest whole number as needed.)5.1.21 Assigned Media Question Help Refer to the accompanying table, which describes the number of adults in groups of five who reported sleepwalking. Find the mean and standard deviation for the numbers of sleepwalkers in groups of five. Click the icon to view the data table. The mean is sleepwalker(s). (Round to one decimal place as needed.) i Table of numbers of sleepwalkers and probabilities - X P(x) 0. 189 0.365 U A W N - OX 0.298 0.111 0.033 0.0045.2.32 Assigned Media Question Help Assume that hybridization experiments are conducted with peas having the property that for offspring, there is a 0.75 probability that a pea has green pods. Assume that the offspring peas are randomly selected in groups of 10. Complete parts (a) through (c) below. a. Find the mean and the standard deviation for the numbers of peas with green pods in the groups of 10. The value of the mean is u = 7.5 peas. (Type an integer or a decimal. Do not round.) The value of the standard deviation is o = 1.4 peas. (Round to one decimal place as needed.) b. Use the range rule of thumb to find the values separating results that are significantly low or significantly high. Values of peas or fewer are significantly low. (Round to one decimal place as needed.)
