Please help me with these excel interpretation. Its really important to me! Thank you so much! Especially question c,d,e
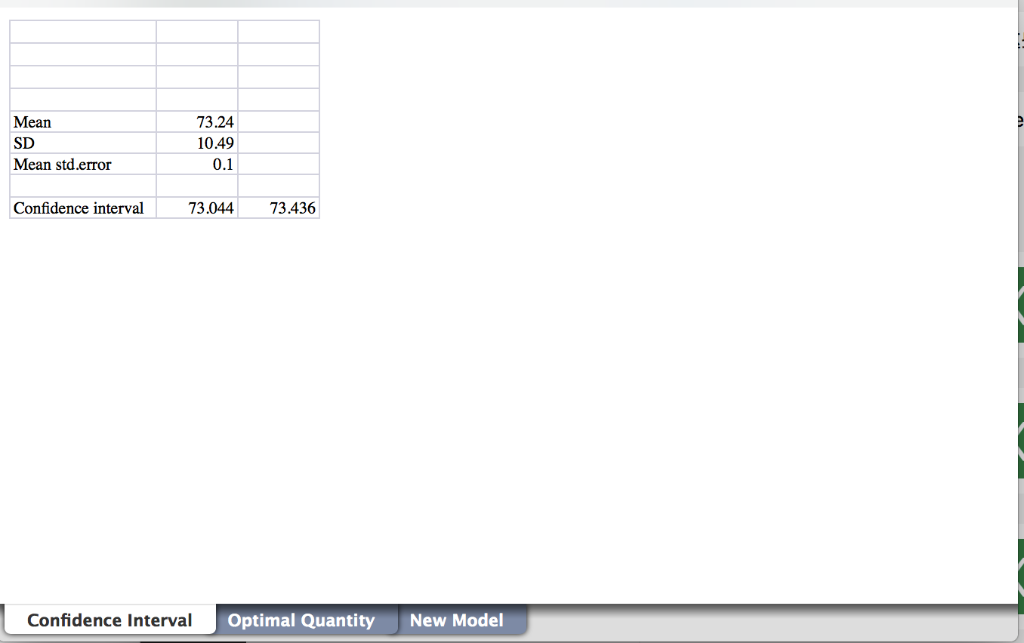
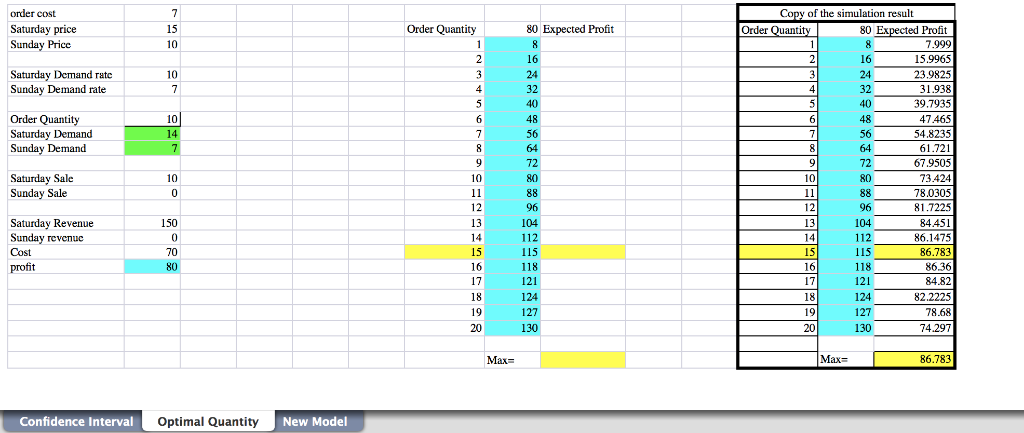
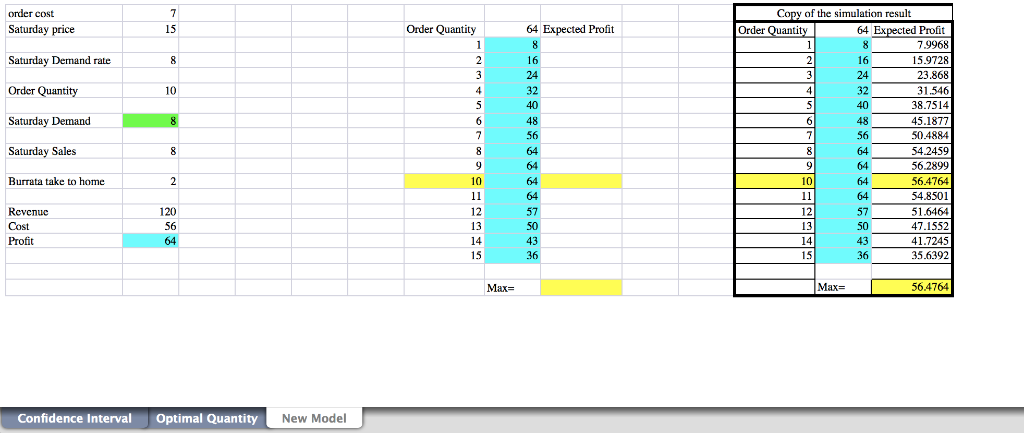
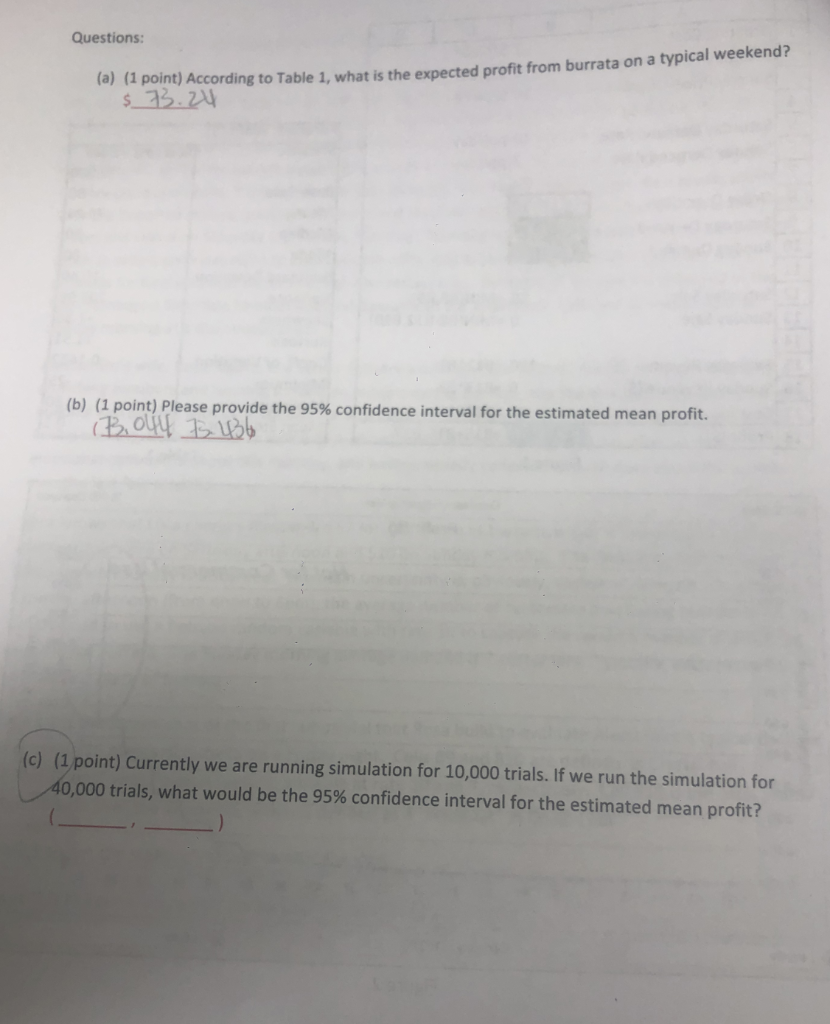
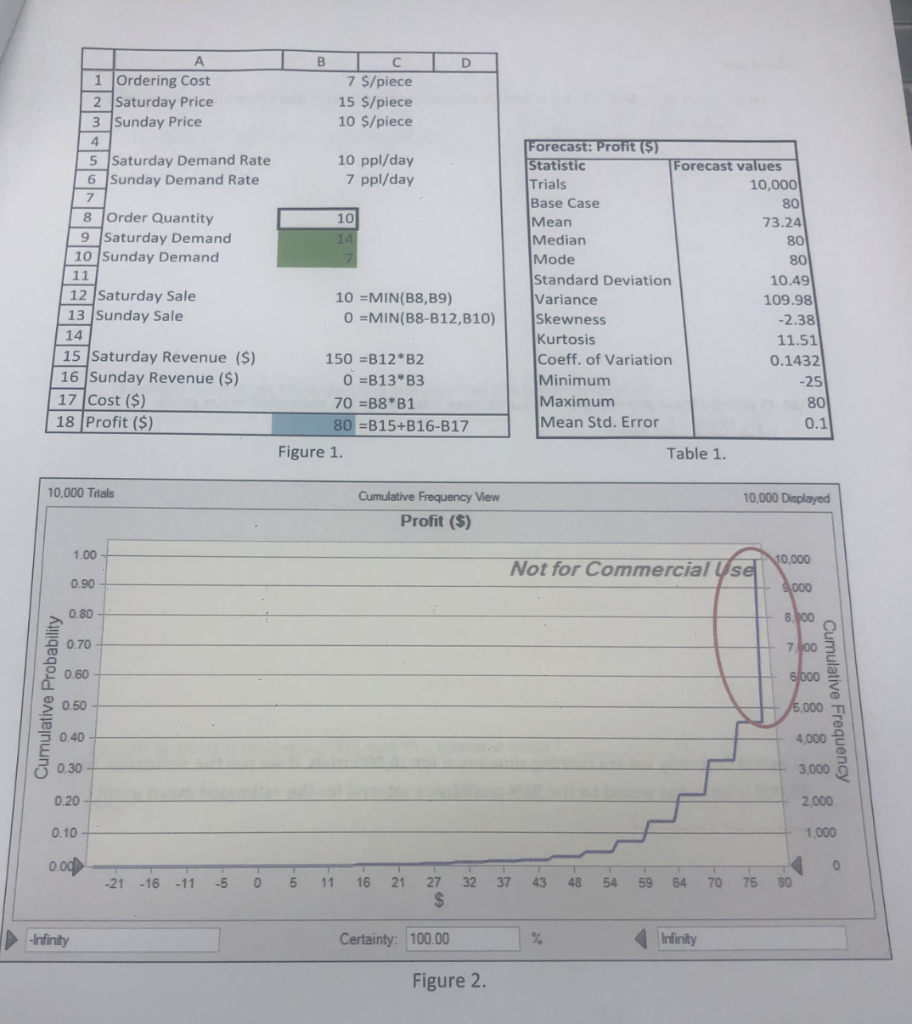
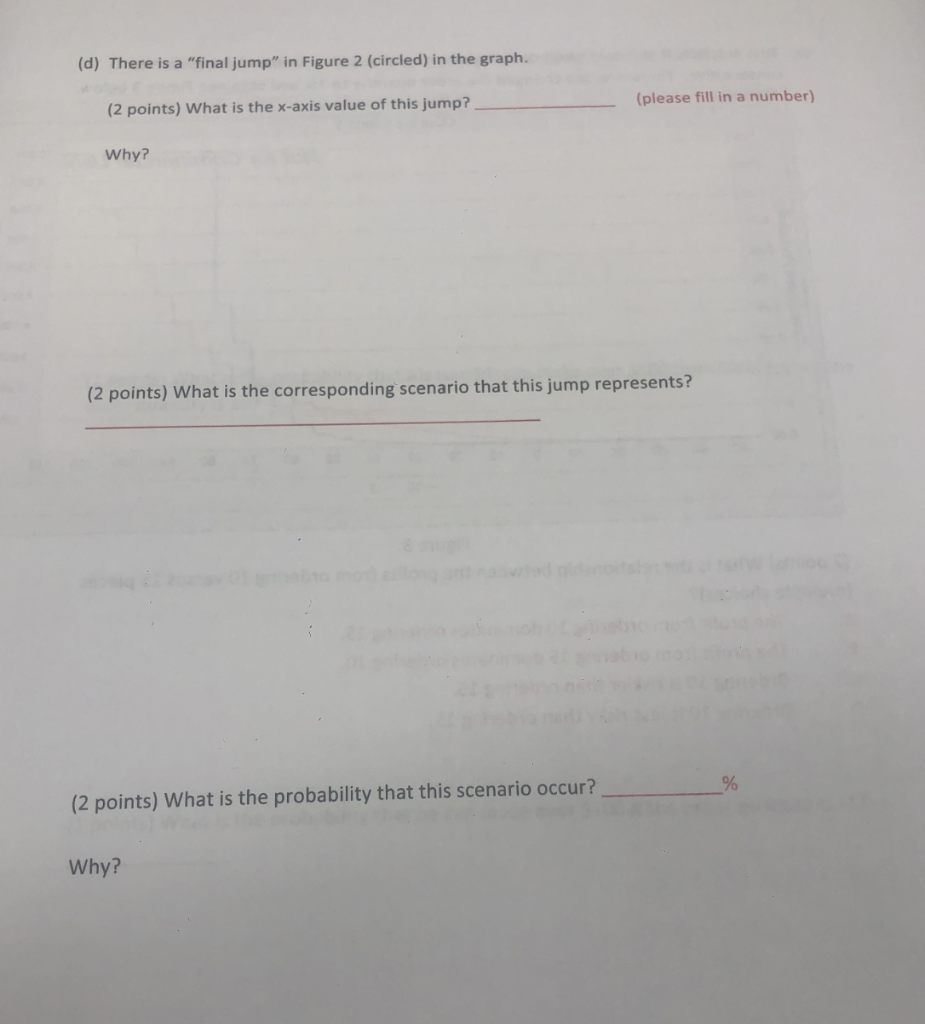
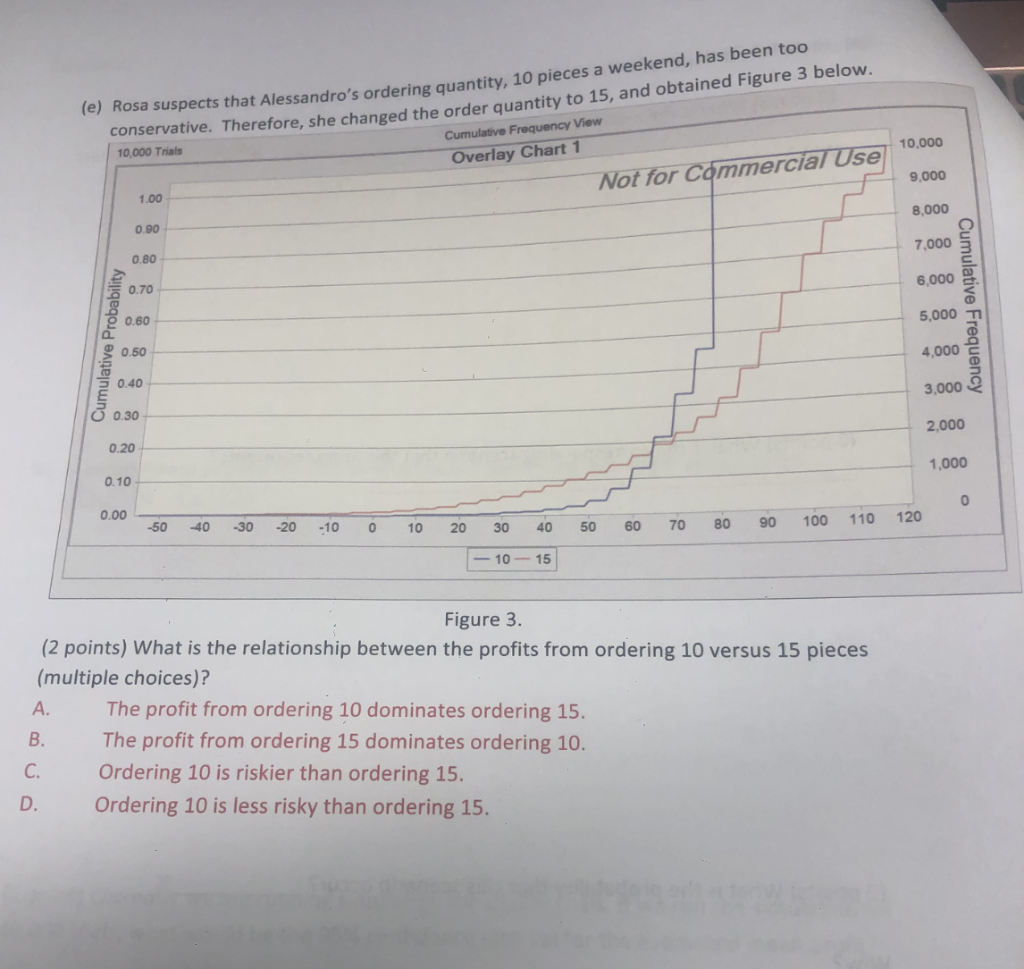
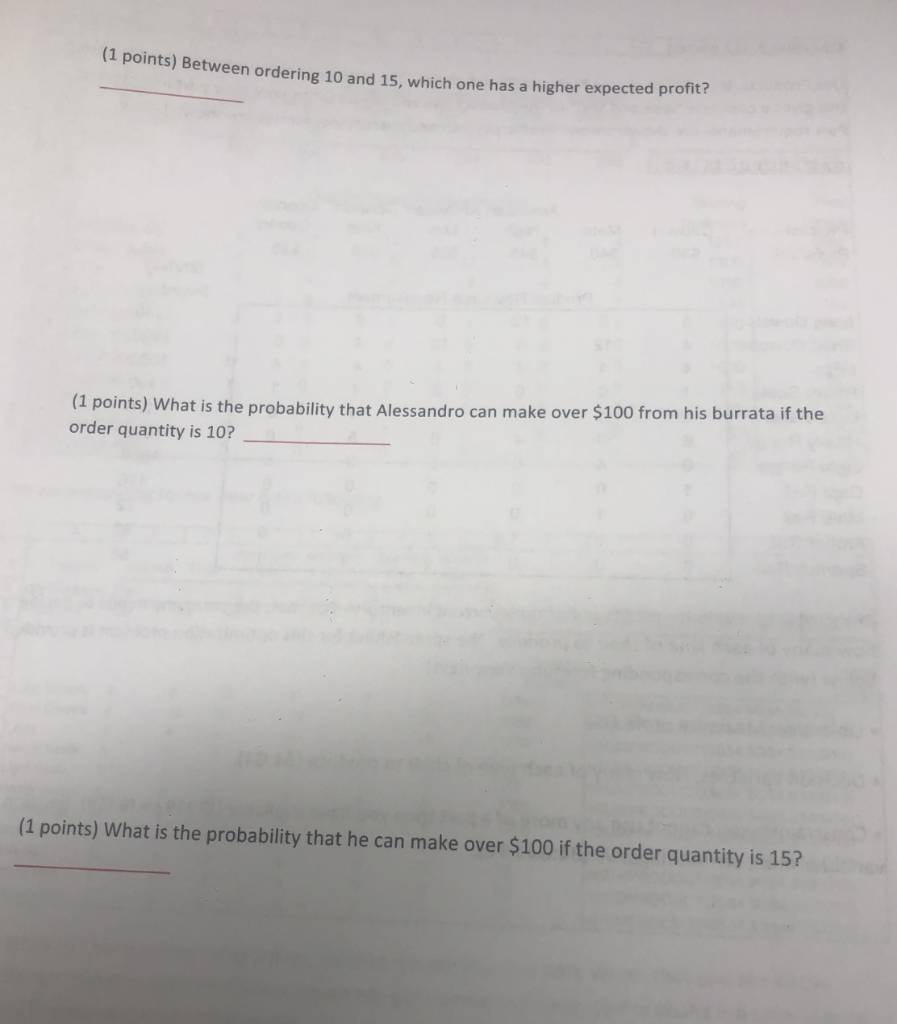
Mean SD Mean std.error 73.24 10.49 0.1 Confidence interval 73.04473.436 Confidence Interval Optimal Quantity New Model order cost Copy of the simulation result 80 Expected Profit Saturday price Order Quantity Order Quantity Saturday Demand ratc Sunday Demand rate Order Quantity Sunday Demand Saturday Revenue Sunday revenuc 150 Max- Max Confidence IntervalO Optimal Quantity New Model Copy of the simulation result order cost Saturday price Saturday Demand rate Order Quantity Saturday Demand Saturday Sales Burrata take to home 15 Order Quantity 64 Expected Profit Order Quantit 64 Expected Profit 7.9968 15.9728 23.868 31.546 38.7514 45.1877 50.4884 54.2459 56.2899 56.4764 54.8501 51.6464 47.1552 41.7245 35.6392 16 24 32 16 32 48 64 64 10 10 64 64 12 13 120 50 13 43 Profit 15 Max- 56.4764 Max Confidence Interval Optimal Quantity New Model Questions: (a) (a point) According to Table 1, what is the expected profit from burrata on a typical weekend? (b) (1 point) Please provide the 95% confidence interval for the estimated mean profit. (1point) Currently we are running simulation for 10,000 trials. If we run the simulation for 0,000 trials, what would be the 95% confidence interval for the estimated mean profit? (c) 1 Ordering Cost 7 S/piece 15 $/piece 10 $/piece 2 Saturday Price 3 Sunday Price Forecast: Profit($ 10 ppl/day 7 ppl/day 5 Saturday Demand Rate Forecast values Statistic Trials Base Case Mean Median Mode Standard Deviation 6 Sunday Demand Rate 10,000 80 8 Order Quantity 9 Saturday Demand 10 Sunday Demand 10 73.24 80 80 10.49 12 Saturday Sale 13 Sunday Sale 10 -MIN(B8,B9) Variance 109.98 O MIN(B8-B12,B10) Skewness 2.38 11.51 0.1432 14 Kurtosis Coeff. of Variation Minimum Maximum Mean Std. Error 15 Saturday Revenue ($) 150 -B12 82 16 Sunday Revenue ($) 0-813" -25 80 0.1 17 Cost (S) 18 Profit (S) 70 -B8*B1 80 B15+B16-B17 Figure 1. Table 1. 10,000 Trials 0,000 Displayed Cumulative Frequency View Profit (S) 1.00 0,000 Not for Commercial Use 0.90 0.80 0.70 0.60 20.50 5 040 0.30 0.20 0.60 4,000 3,000 9 2,000 1,000 0.10 -21 -16 -11 5 05 11 16 21 27 32 37 43 48 54 59 64 70 75 0 -nfinty Certainty: 100.00 Figure 2. (d) There is a "final jump" in Figure 2 (circled) in the graph. (2 points) What is the x-axis value of this jump?(please fil in a number) Why? 2 points) What is the corresponding scenario that this jump represents? (2 points) What is the probability that this scenario occur? Why? (e) Rosa suspects that Alessandro's ordering quantity, 10 pieces a weekend, has been too conservative. Therefore, she changed the order quantity to 15, and obtained Figure 3 below. Cumulative Frequency View 10,000 Trials Overlay Chart 1 10,000 ot for Commercial Use 1.00 0.90 0.80 0.70 9,000 8,000 7,000 6,000 5,000 4,000 2 3,000 2 2,000 S 0.60 0.50 50.40 O 0.30 0.20 0.10 1,000 0.00 -50-40-30-2010 0 10 20 30 40 50 60 70 80 90 100 1-10-15 Figure 3. (2 points) What is the relationship between the profits from ordering 10 versus 15 pieces (multiple choices)? A. The profit from ordering 10 dominates ordering 15. B. The profit from ordering 15 dominates ordering 10. C. Ordering 10 is riskier than ordering 15. D. Ordering 10 is less risky than ordering 15. (1 points) B etween ordering 10 and 15, which one has a higher expected profit? can make over $100 from his burrata if the (1 points) What is the probability that Alessandro order quantity is 10? (1 points) What is the probability that he can make over $100 if the order quantity is 15? Mean SD Mean std.error 73.24 10.49 0.1 Confidence interval 73.04473.436 Confidence Interval Optimal Quantity New Model order cost Copy of the simulation result 80 Expected Profit Saturday price Order Quantity Order Quantity Saturday Demand ratc Sunday Demand rate Order Quantity Sunday Demand Saturday Revenue Sunday revenuc 150 Max- Max Confidence IntervalO Optimal Quantity New Model Copy of the simulation result order cost Saturday price Saturday Demand rate Order Quantity Saturday Demand Saturday Sales Burrata take to home 15 Order Quantity 64 Expected Profit Order Quantit 64 Expected Profit 7.9968 15.9728 23.868 31.546 38.7514 45.1877 50.4884 54.2459 56.2899 56.4764 54.8501 51.6464 47.1552 41.7245 35.6392 16 24 32 16 32 48 64 64 10 10 64 64 12 13 120 50 13 43 Profit 15 Max- 56.4764 Max Confidence Interval Optimal Quantity New Model Questions: (a) (a point) According to Table 1, what is the expected profit from burrata on a typical weekend? (b) (1 point) Please provide the 95% confidence interval for the estimated mean profit. (1point) Currently we are running simulation for 10,000 trials. If we run the simulation for 0,000 trials, what would be the 95% confidence interval for the estimated mean profit? (c) 1 Ordering Cost 7 S/piece 15 $/piece 10 $/piece 2 Saturday Price 3 Sunday Price Forecast: Profit($ 10 ppl/day 7 ppl/day 5 Saturday Demand Rate Forecast values Statistic Trials Base Case Mean Median Mode Standard Deviation 6 Sunday Demand Rate 10,000 80 8 Order Quantity 9 Saturday Demand 10 Sunday Demand 10 73.24 80 80 10.49 12 Saturday Sale 13 Sunday Sale 10 -MIN(B8,B9) Variance 109.98 O MIN(B8-B12,B10) Skewness 2.38 11.51 0.1432 14 Kurtosis Coeff. of Variation Minimum Maximum Mean Std. Error 15 Saturday Revenue ($) 150 -B12 82 16 Sunday Revenue ($) 0-813" -25 80 0.1 17 Cost (S) 18 Profit (S) 70 -B8*B1 80 B15+B16-B17 Figure 1. Table 1. 10,000 Trials 0,000 Displayed Cumulative Frequency View Profit (S) 1.00 0,000 Not for Commercial Use 0.90 0.80 0.70 0.60 20.50 5 040 0.30 0.20 0.60 4,000 3,000 9 2,000 1,000 0.10 -21 -16 -11 5 05 11 16 21 27 32 37 43 48 54 59 64 70 75 0 -nfinty Certainty: 100.00 Figure 2. (d) There is a "final jump" in Figure 2 (circled) in the graph. (2 points) What is the x-axis value of this jump?(please fil in a number) Why? 2 points) What is the corresponding scenario that this jump represents? (2 points) What is the probability that this scenario occur? Why? (e) Rosa suspects that Alessandro's ordering quantity, 10 pieces a weekend, has been too conservative. Therefore, she changed the order quantity to 15, and obtained Figure 3 below. Cumulative Frequency View 10,000 Trials Overlay Chart 1 10,000 ot for Commercial Use 1.00 0.90 0.80 0.70 9,000 8,000 7,000 6,000 5,000 4,000 2 3,000 2 2,000 S 0.60 0.50 50.40 O 0.30 0.20 0.10 1,000 0.00 -50-40-30-2010 0 10 20 30 40 50 60 70 80 90 100 1-10-15 Figure 3. (2 points) What is the relationship between the profits from ordering 10 versus 15 pieces (multiple choices)? A. The profit from ordering 10 dominates ordering 15. B. The profit from ordering 15 dominates ordering 10. C. Ordering 10 is riskier than ordering 15. D. Ordering 10 is less risky than ordering 15. (1 points) B etween ordering 10 and 15, which one has a higher expected profit? can make over $100 from his burrata if the (1 points) What is the probability that Alessandro order quantity is 10? (1 points) What is the probability that he can make over $100 if the order quantity is 15


