Please help me with this, I am failing terribly and its due tonight. You can choose whichever you want one through 5, just please help me, thank you so much in advance
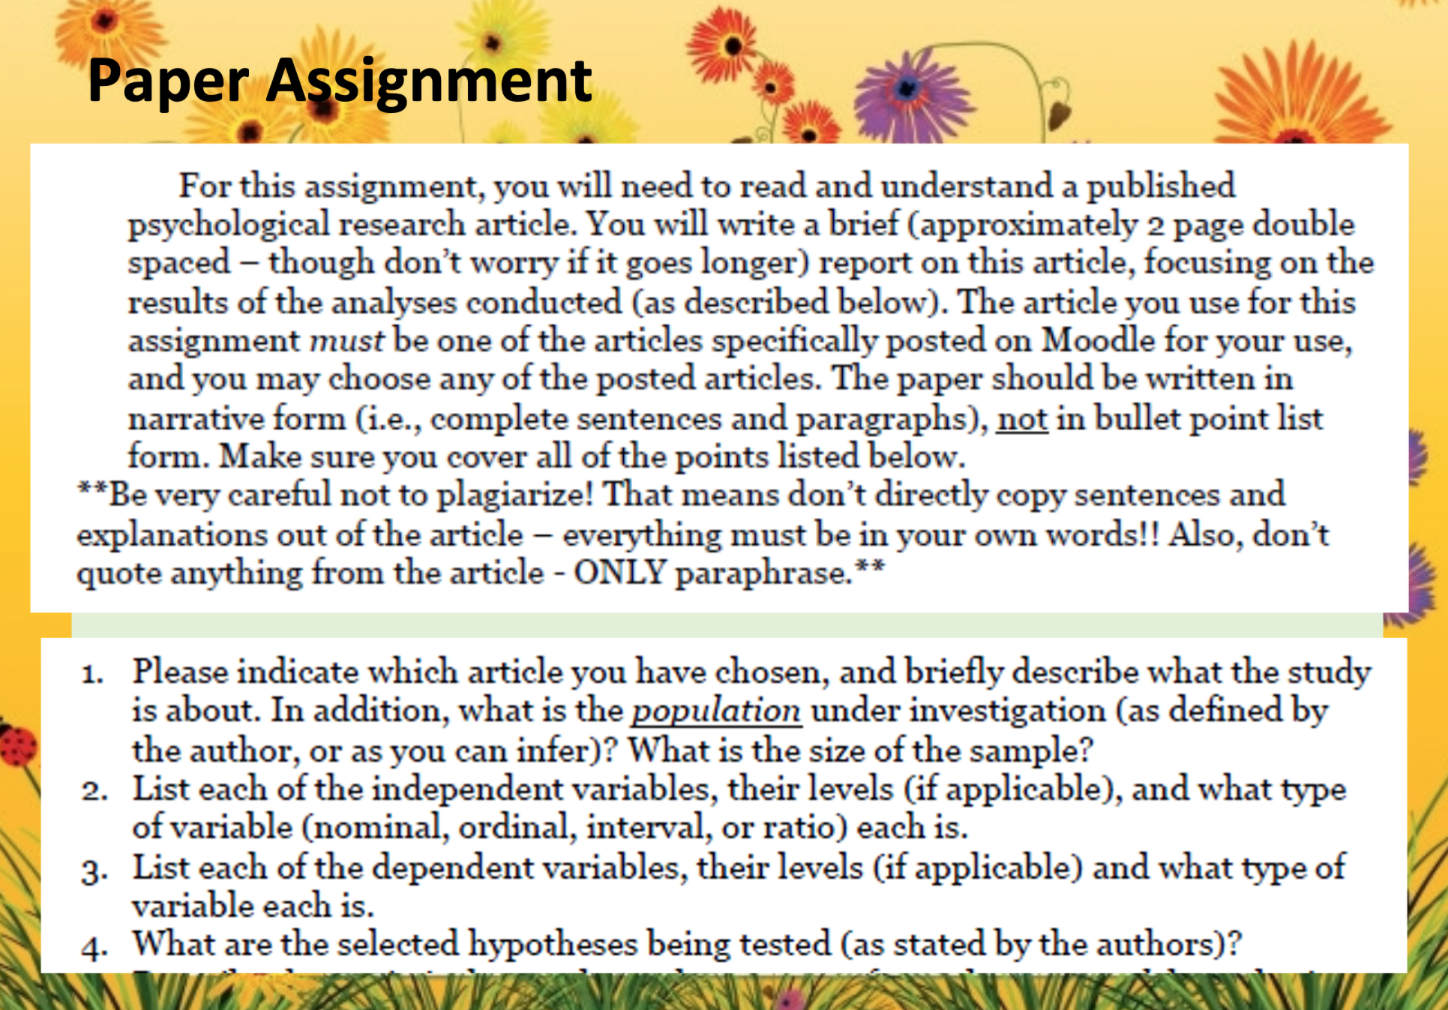
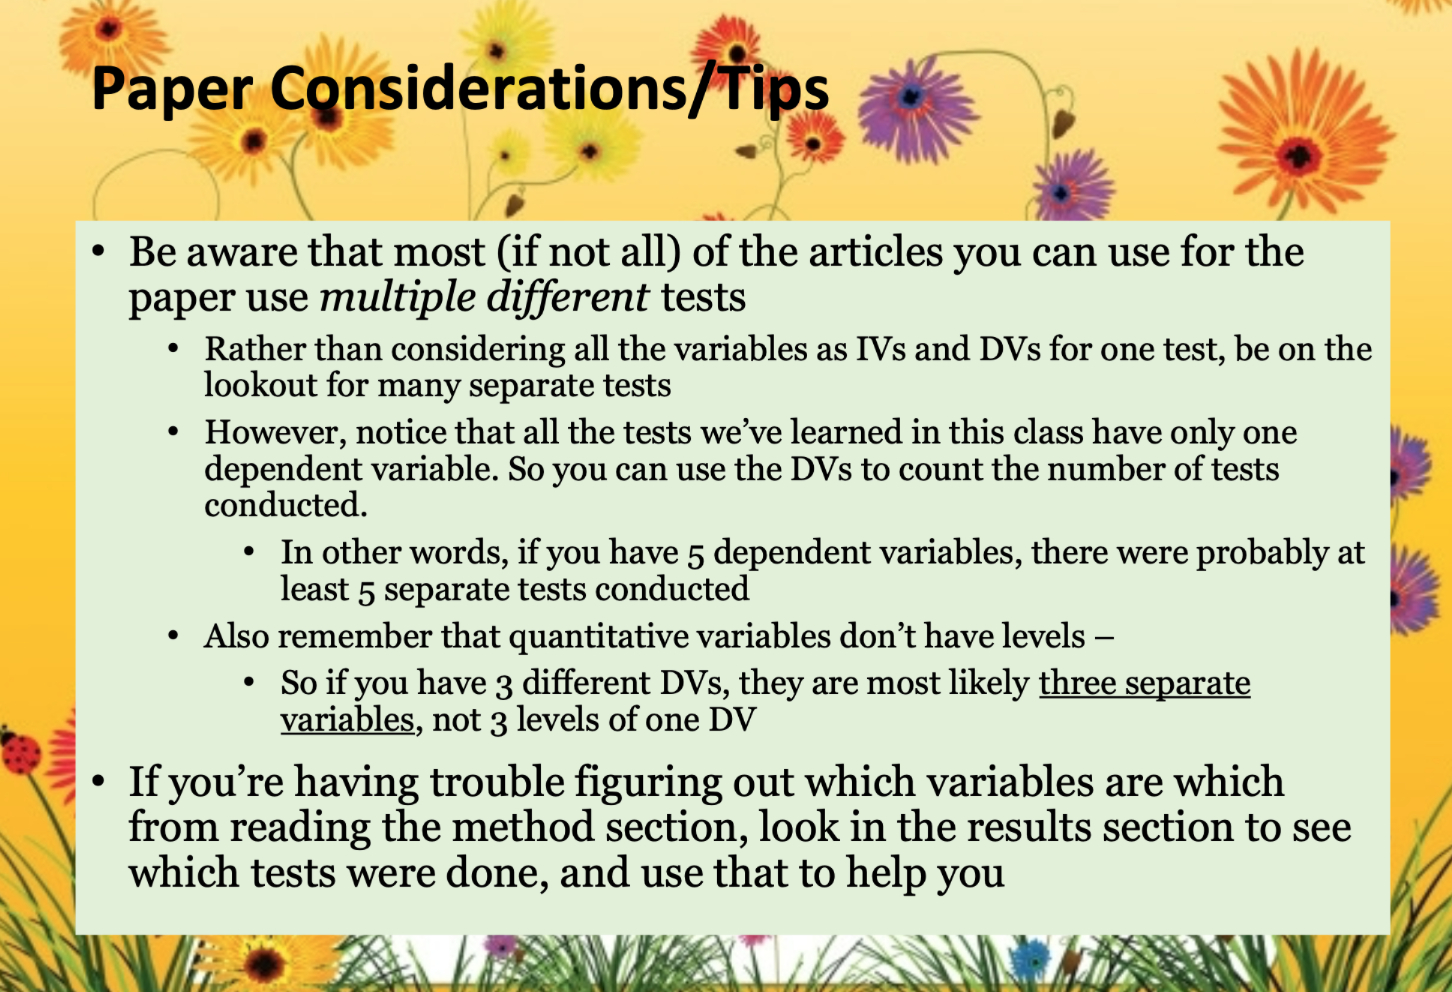
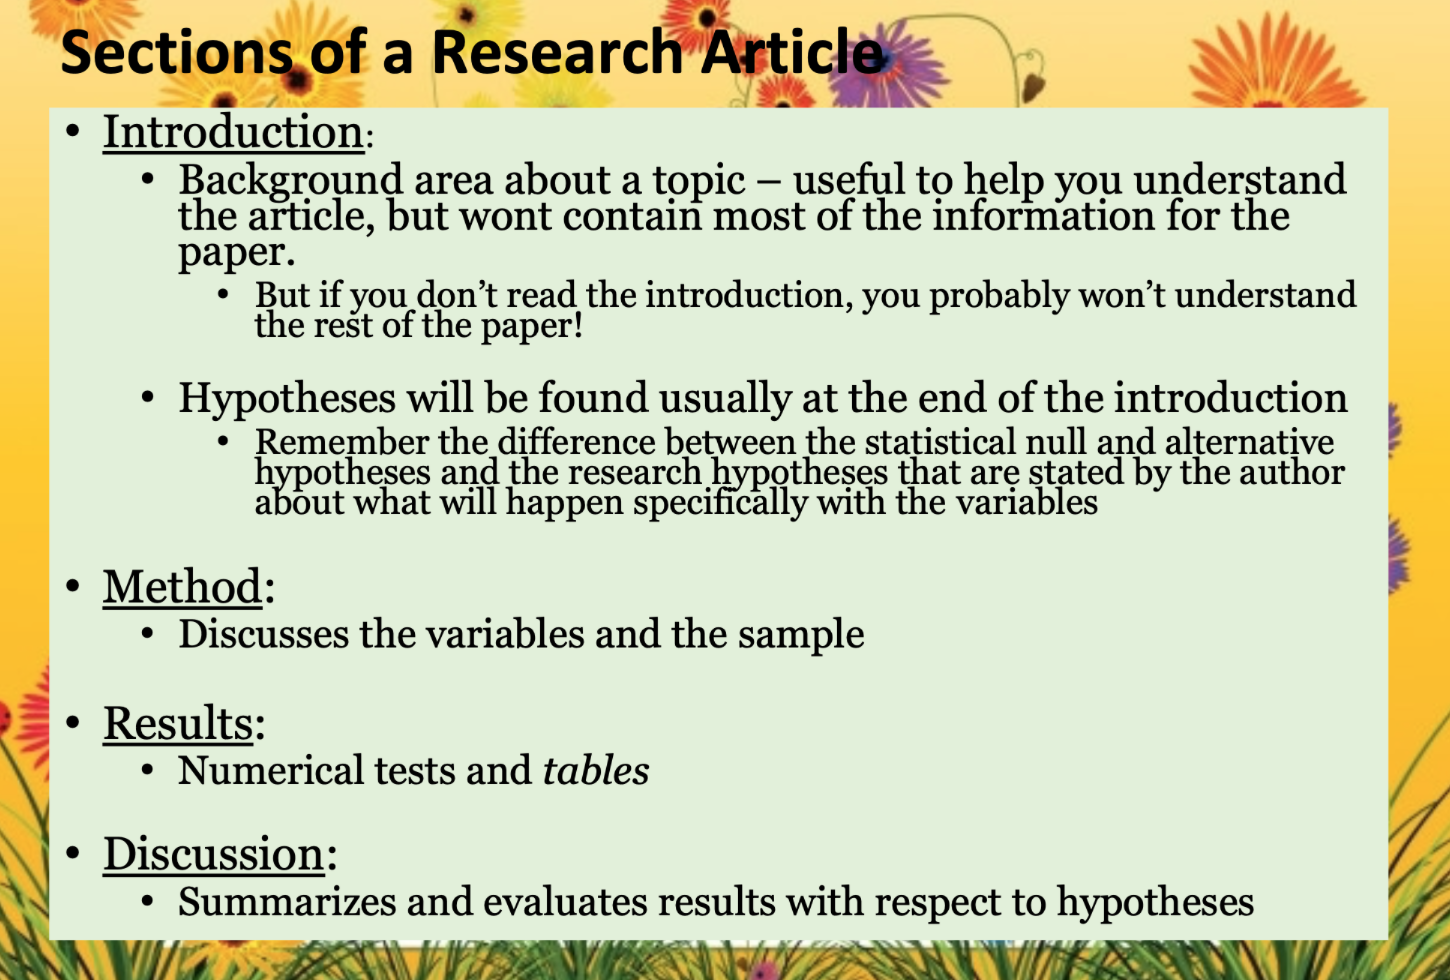
For this assignment, you will need to read and understand a published psychological research article. You will write a brief (approximately 2 page double spaced - though don't worry if it goes longer) report on this article, focusing on the results of the analyses conducted (as described below). The article you use for this assignment must be one of the articles specically posted on Moodle for your use, and you may choose any of the posted articles. The paper should be written in narrative form (Le., complete sentences and paragraphs), n_ot in bullet point list form. Make sure you cover all of the points listed below. "Be very careful not to plagiarize! That means don't directly copy sentences and explanations out of the article everything must be in your own words!! Also, don't quote anything from the article - ONLY paraphrase." 1. Please indicate which article you have chosen, and briey describe what the study is about. In addition, what is the population under investigation (as dened by the author, or as you can infer)? What is the size of the sample? 2. List each of the independent variables, their levels (if applicable), and what type of variable (nominal, ordinal, interval, or ratio) each is. 3. List each of the dependent variables, their levels (if applicable) and what type of variable each is. 4. What are the selected hypotheses being tested (as stated by the authors)? Paper Considerations/Tips . Be aware that most (if not all) of the articles you can use for the paper use multiple different tests . Rather than considering all the variables as IVs and DVs for one test, be on the lookout for many separate tests . However, notice that all the tests we've learned in this class have only one dependent variable. So you can use the DVs to count the number of tests conducted. . In other words, if you have 5 dependent variables, there were probably at least 5 separate tests conducted . Also remember that quantitative variables don't have levels - . So if you have 3 different DVs, they are most likely three separate variables, not 3 levels of one DV . If you're having trouble figuring out which variables are which from reading the method section, look in the results section to see which tests were done, and use that to help youSections of a Research Article Introduction: . Background area about a topic - useful to help you understand the article, but wont contain most of the information for the paper. . But if you don't read the introduction, you probably won't understand the rest of the paper! . Hypotheses will be found usually at the end of the introduction . Remember the difference between the statistical null and alternative hypotheses and the research hypotheses that are stated by the author about what will happen specifically with the variables . Method: . Discusses the variables and the sample . Results: . Numerical tests and tables Discussion: . Summarizes and evaluates results with respect to hypothesesIntroduction Section American sample. We hypothesised that: (a) child cognitive ability, positive parenting, and maternal verbal intelligence would be associated with greater child emotion knowledge; (b) child negative emotionality, negative parenting, maternal depressive symptoms, and environmental risk would be associated with lower emotion knowledge . What variables are listed? . Can we tell what type they are? What tests will be done? . Where else can we look?Predictor measures Cognitive ability. At 2 years, the Bayley Scales of Infant Development-II (Bayley, 1993) were administered. At 4 years, the Stanford-Binet Intelligence Scale, Fourth edition (SB-IV; Thorndike, Hagen, & Sattler, 1986) was administered. Both measures have extensive standardisation data and satisfac tory reliability, including with African American children (Bayley, 1993; Krohn & Lamp, 1999; Thorndike et al., 1986). Negative emotionality. A negative emotionality composite score was derived at 2 years from the sum of the standardised scores from the following seven developmentally appropriate tasks indicated in Table 1. In the modified . In the method section there should be a place where each variable is listed, with the way it's measured.TABLE 2 Means (and standard deviations) of predictor and outcome variables Mean (SD) Predictor variables Child cognitive ability Two years 83.1 (10.1) 178 Four years 84.7 (11.4) 175 Maternal characteristics Depressive symptoms 5.9 (6.5) 174 Verbal intelligence 72.3 (14.6) 170 Outcome variables Expression labelling 1.6 (1.4) 188 Expression recognition 5.6 (2.7) 188 Situational knowledge 6.8 (2.7) 188 . Or, we can look in the results section in the text or tables to see the variables listed with each test. . We can also tell these are quantitative because the author reports means!5. Describe the statistical procedures that were performed to test each hypothesis. For each procedure done, answer the following questions: o What type of test was done? What variables were involved? o Why was this particular test done to analyze these variables? Be specific! For example, if they used a paired t-test, you should explain why a t-test was used at all, but also why specifically a paired t-test. Your answer should be based on the number of variables, their types, and/ or their levels. o What were the numerical results of the test(s)? (For example, F(2,8)=5.60, p<.05 there may be multiple numerical results pertaining to one hypothesis. sure list them all. o was it they significant interpret the of test as well p value what does a or>.05 mean in real terms?). o What does this mean in terms of the variables under study (i.e., was one group higher on some measurement than another?)? o Was the hypothesis supported? 6. Briefly summarize the overall main findings of this article.Correlation Table Example Correlations among predictor and outcome variables Distal Predictors (2 years) Proximal Predictors (4 years) Emotion knowledge Cog Emot Env NegP PosP Cog Emot Env NegP PosP Dep VIQ Sex Label Rec Sit Comp Distal predictor variables (2 years) Child cognitive ability Child negative emotionality -.02 Environmental risk -.22++ 06 Negative parenting -.06 22+ .00 Positive parenting .05 -.09 07 .06 Proximal predictor variables (4 years) Child cognitive ability .03 -.15# -.08 .11 Child negative emotionality .04 -.05 .01 .19# .12 .09 Environmental risk -.17+ .05 47+** .08 -.02 -.23++ .10 Negative parenting -.04 .03 .14# .08 -.02 -. 12 -.01 .15+ Positive parenting .19++ .01 -26*+* -,19* -12 .24*++ -.04 - 34* **-.04 Maternal depressive symptoms -.04 .06 26*** .13 .01 -06 -08 .28*+ 28+++-30+++ Maternal verbal intelligence .22++ 16* -21** -,18# .03 .40*+* -.02 -.27* *+-.04 Child sex 36*** -.02 .16+ -.13 -.01 -.07 .07 .07 -01 .10 .03 -16* .03 -.06 Emotion knowledge variables Labelling of expressions 32+++ 05 - 220* -11 .02 .50*** -.01 - 23++ .01 23** -.10 .35++ Recognition of expressions -.03 -07 -28*+* -.08 -03 .38*** .00 -.22+* -.03 .19** -.14# .30+++ Situational knowledge .10 .56* *+ 31 ++ .06 -.19* -.17# .01 .35*+* -,15# -.20* .02 07 Composite .02 .25++ .09 40*++ .02 .38* *+ 34+++ -29*+* -.16 .00 .52*+* -.07 - 27** .00 21** -.09 .38*++ .08 .82+*+ ,80+ .73+++ *pS .05, two-tailed; "ps .01; "*+p S .001.Table I Sample group statistics by gender (Patients/Healthy-males n = 157/309; females n = 296/541) Mean SD P Males Females Males Females Age Patients 40.77 42.54 13.09 12.13 -1.44 0.201 Normal subjects 34.84 35.95 14.60 14.92 -1.05 0.301 Novelty Seeking Patients 17.24 17.49 6.46 5.50 -0.37 0.720 . Normal females Normal subjects 19.55 19.58 6.01 5.47 -0.07 0.949 were more harm avoidant, reward Harm Avoidance Patients 22.30 dependent, 22.76 6.59 6.68 -0.64 Normal subjects 0.555 14.83 16.56 5.92 6.05 cooperative, and -4.04