Answered step by step
Verified Expert Solution
Link Copied!

Question

1 Approved Answer

Please help me with this matter and provide step by step solution. thanks. Answer all the questions [15 marks] 1. Draw a scatter diagram for

Please help me with this matter and provide step by step solution. thanks.
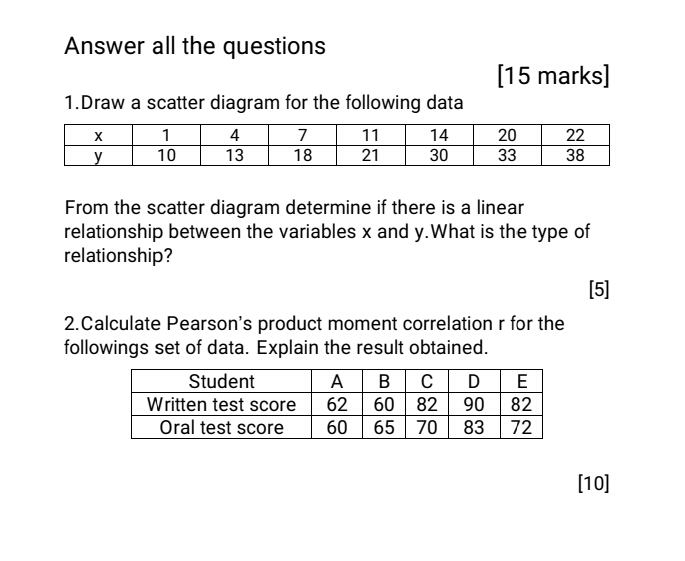
image text in transcribed
Answer all the questions [15 marks] 1. Draw a scatter diagram for the following data X 1 4 7 11 14 20 22 y 10 13 18 21 30 33 38 From the scatter diagram determine if there is a linear relationship between the variables x and y. What is the type of relationship? [5] 2. Calculate Pearson's product moment correlation r for the followings set of data. Explain the result obtained. Student A B C D E Written test score 62 60 82 90 82 Oral test score 60 65 70 83 72 [10]

Step by Step Solution

There are 3 Steps involved in it

Step: 1

blur-text-image

Get Instant Access to Expert-Tailored Solutions

See step-by-step solutions with expert insights and AI powered tools for academic success

Step: 2

blur-text-image

Step: 3

blur-text-image

Ace Your Homework with AI

Get the answers you need in no time with our AI-driven, step-by-step assistance

Get Started

Recommended Textbook for

Algebra And Trigonometry, Enhanced

Authors: Cynthia Y Young

4th Edition

1119320860, 9781119320869

More Books

Students also viewed these Mathematics questions

Question

7. Understand the challenges of multilingualism.

Answered: 1 week ago