please help
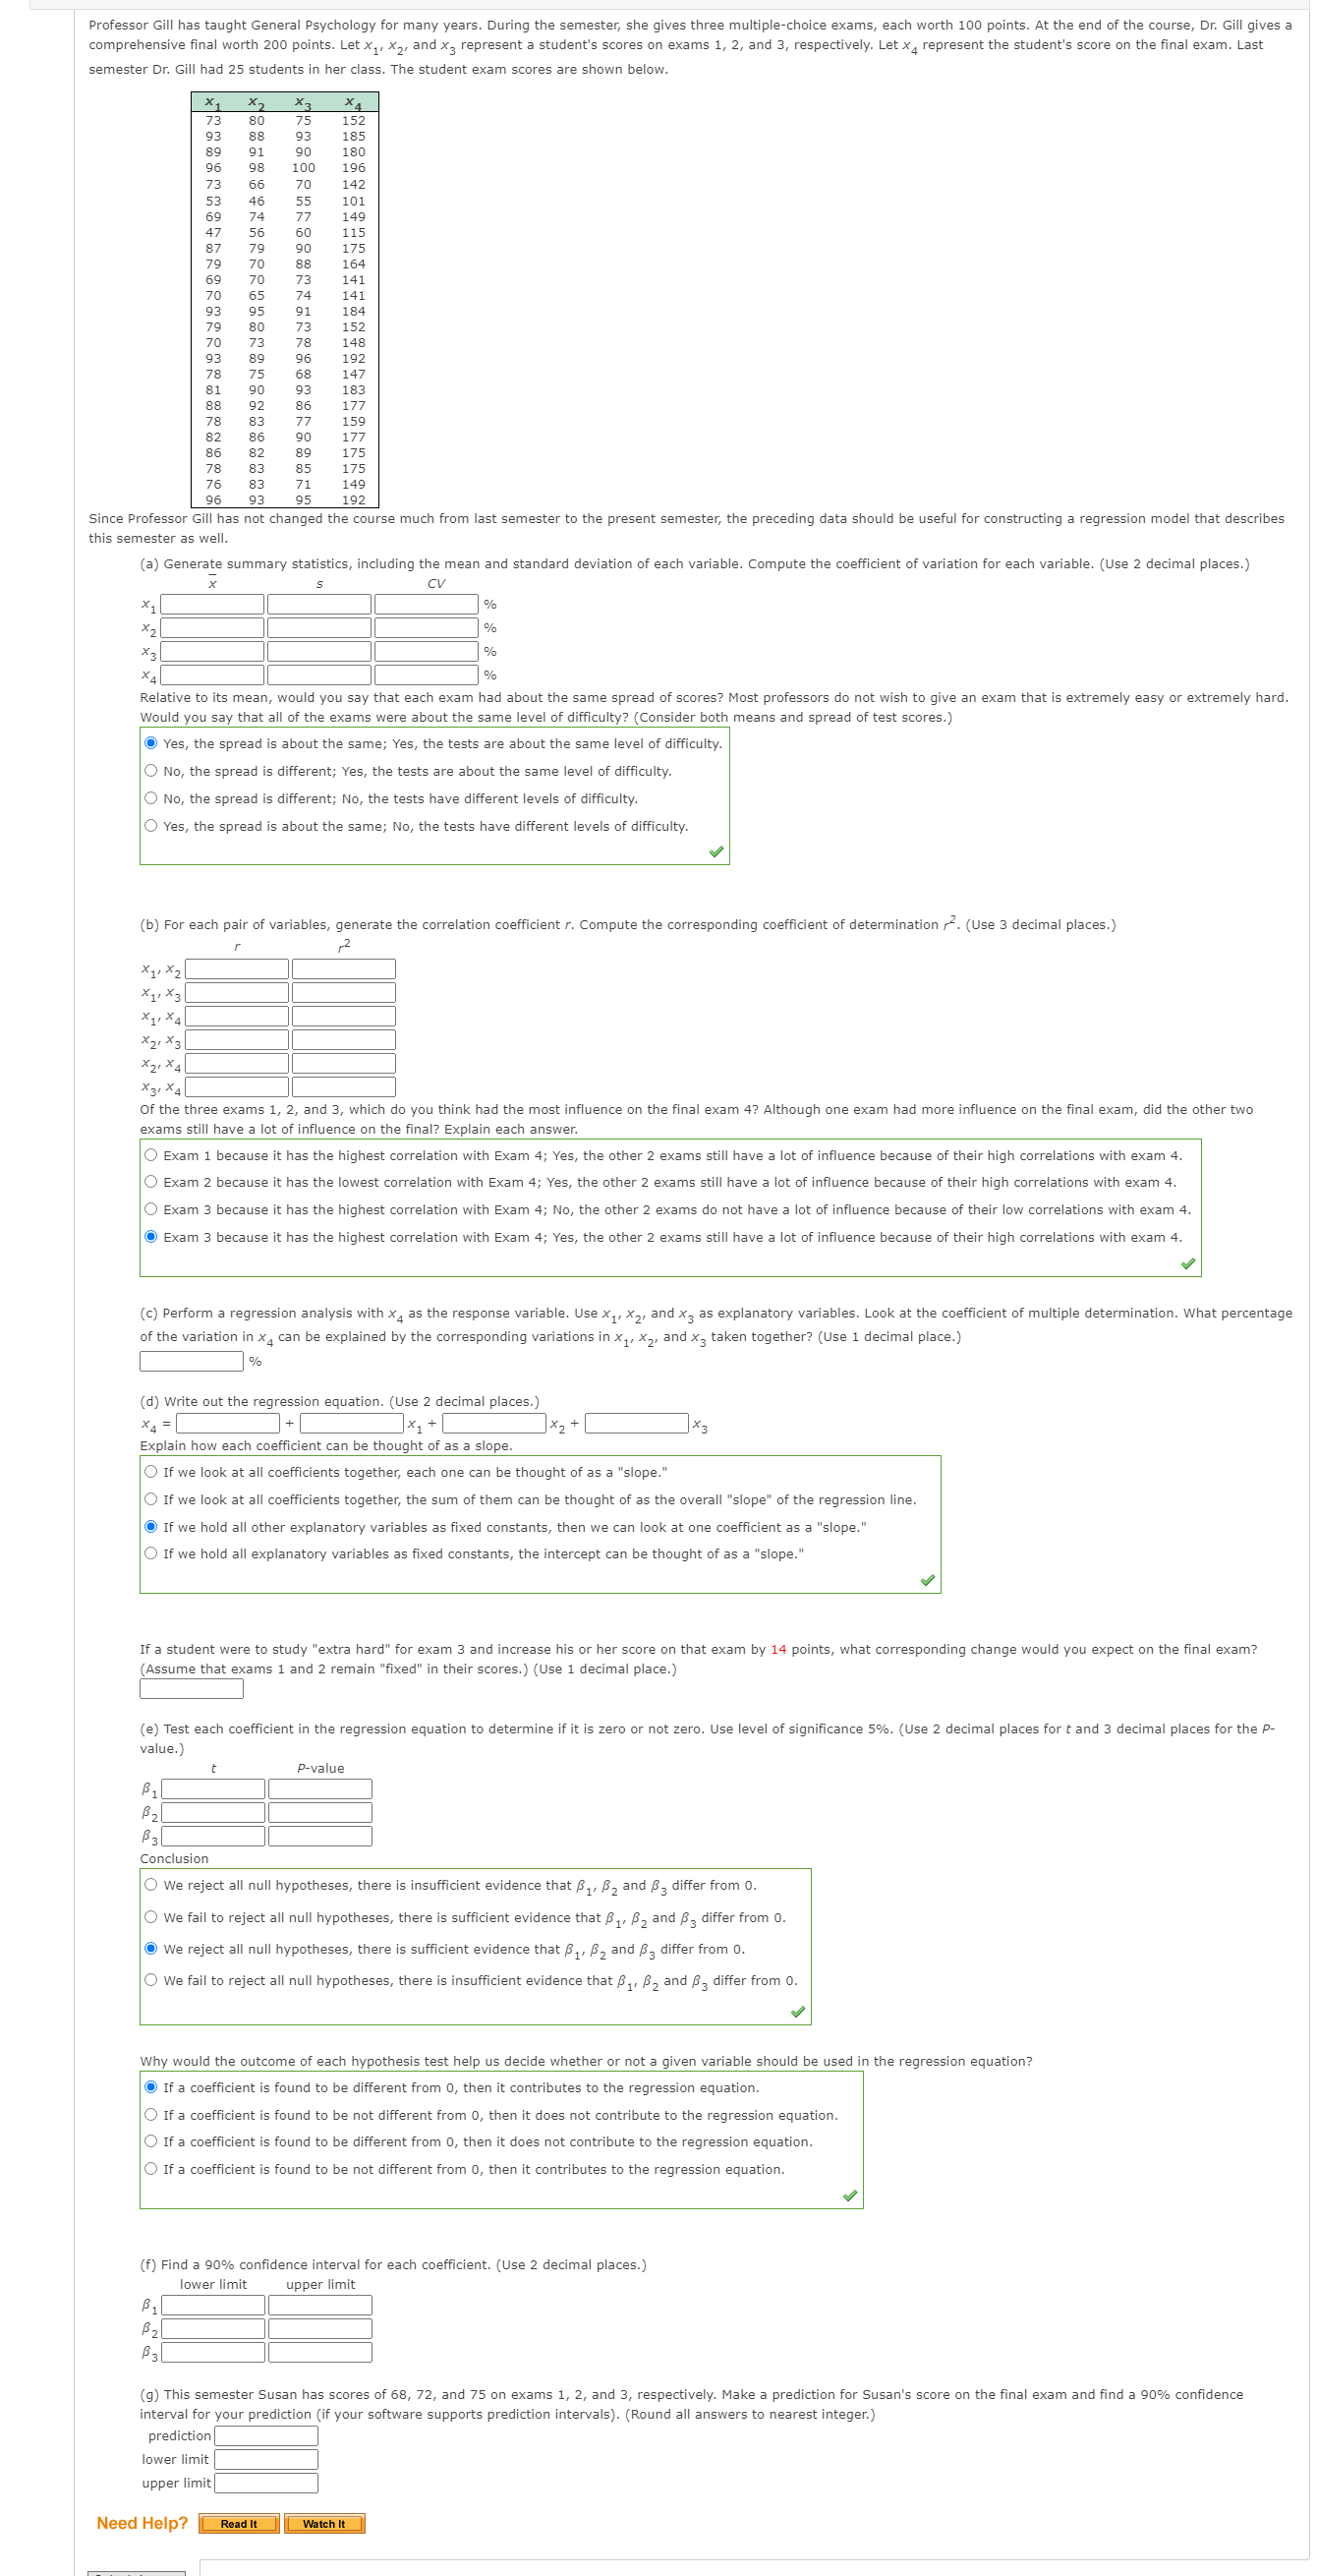
Professor Gill has taught General Psychology for many years. During the semester, she gives three multiple-choice exams, each worth 100 points. At the end of the course, Dr. Gill gives a comprehensive final worth 200 points. Let X], X2, and X? represent a student's scores on exams 1, 2, and 3, respectively. Let x4 represent the student's score on the final exam. Last semester Dr. Gill had 25 students in her class. The student exam scores are shown below. 152 185 90 180 100 196 DON68 8288 70 142 55 101 77 149 60 115 90 175 88 70 73 74 141 91 184 152 148 192 78 89 96 90 68 147 183 92 86 77 159 86 90 177 89 175 85 175 83 71 149 93 95 192 Since Professor Gill has not changed the course much from last semester to the present semester, the preceding data should be useful for constructing a regression model that describes this semester as well. (a) Generate summary statistics, including the mean and standard deviation of each variable. Compute the coefficient of variation for each variable. (Use 2 decimal places.) CV X1 1% Relative to its mean, would you say that each exam had about the same spread of scores? Most professors do not wish to give an exam that is extremely easy or extremely hard. Would you say that all of the exams were about the same level of difficulty? (Consider both means and spread of test scores.) Yes, the spread is about the same; Yes, the tests are about the same level of difficulty No, the spread is different; Yes, the tests are about the same level of difficulty. No, the spread is different; No, the tests have different levels of difficulty. Yes, the spread is about the same; No, the tests have different levels of difficulty. (b) For each pair of variables, generate the correlation coefficient r. Compute the corresponding coefficient of determination . (Use 3 decimal places.) X11 X2 *1, X3 X1, X4 X21 X3 X21 X4 *31 X4 Of the three exams 1, 2, and 3, which do you think had the most influence on the final exam 4? Although one exam had more influence on the final exam, did the other two exams still have a lot of influence on the final? Explain each answer. O Exam 1 because it has the highest correlation with Exam 4; Yes, the other 2 exams still have a lot of influence because of their high correlations with exam 4. Exam 2 because it has the lowest cor ation with Exam 4; Yes, the ause of their high correlations with exam 4. Exam 3 because it has the highest correlation with Exam 4; No, the other 2 exams do not have a lot of influence because of their low correlations with exam 4. Exam 3 because it has the highest correlation with Exam 4; Yes, the other 2 exams still have a lot of influence because of their high correlations with exam 4. (c) Perform a regression analysis with x4 as the response variable. Use X1, X2, and x3 as explanatory variables. Look at the coefficient of multiple determination. What percentage of the variation in x can be explained by the corresponding variations in X1, X2, and x3 taken together? (Use 1 decimal place.) (d) Write out the regression equation. (Use 2 decimal places.) X4 = Explain how each coefficient can be thought of as a slope. If we look at all coefficients together, each one can be thought of as a "slope." If we look at all coefficients together, the sum of them can be thought of as the overall "slope" of the regression line. If we hold all other explanatory variables as fixed constants, then we can look at one coefficient as a "slope." If we hold all explanatory variables as fixed constants, the intercept can be thought of as a "slope." If a student were to study "extra hard" for exam 3 and increase his or her score on that exam by 14 points, what corresponding change would you expect on the final exam? Assume that exams 1 and 2 remain "fixed" in their scores.) (Use 1 decimal place.) (e) Test each coefficient in the regression equation to determine if it is zero or not zero. Use level of significance 5%. (Use 2 decimal places for t and 3 decimal places for the P- value.) P-value P1 B3 Conclusion O We reject all null hypotheses, there is insufficient evidence that B1 . B2 and B3 differ from 0. O We fail to reject all null hypotheses, there is sufficient evidence that B1 , B2 and B3 differ from 0. We reject all null hypotheses, there is sufficient evidence that B1. B2 and By differ from 0. O We fail to reject all null hypotheses, there is insufficient evidence that B1. B2 and B3 differ from 0. Why would the outcome of each hypothesis test help us decide whether or not a given variable should be used in the regression equation? If a coefficient is found to be different from 0, then it contributes to the regression equation. If a coefficient is found to be not different from 0, then it does not contribute to the regression equation. If a coefficient is found to be different from 0, then it does not contribute to the regression equation. If a coefficient is found to be not different from 0, then it contributes to the regression equation. (f) Find a 90% confidence interval for each coefficient. (Use 2 decimal places.) lower limit upper limit P1 g) This semester Susan has scores of 68, 72, and 75 on exams 1, 2, and 3, respectively. Make a prediction for Susan's score on the final exam and find a 90% confidence interval for your prediction (if your software supports prediction intervals). (Round all answers to nearest integer.) prediction ower limit upper limit Need Help? Read It Watch It


