Answered step by step
Verified Expert Solution
Question
1 Approved Answer
please help! solve this! m(s) Saved ($ thousands) Sales Cost of goods sold Gross profit Operating expenses Net income HAROUN COMPANY Comparative Income Statements For
please help! solve this! 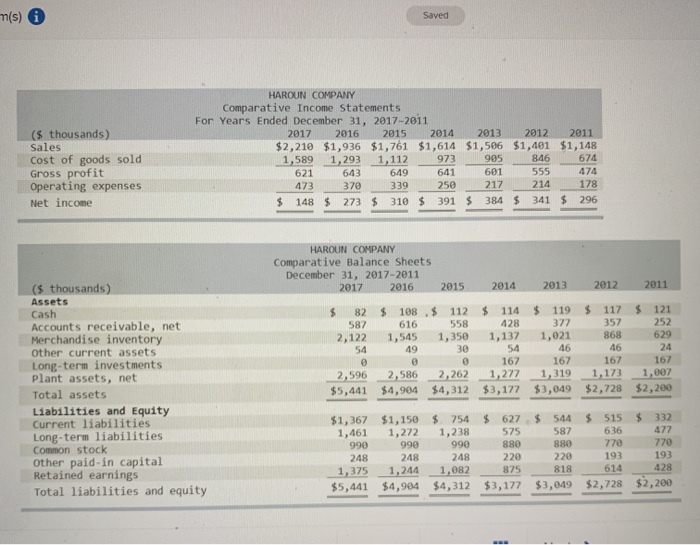
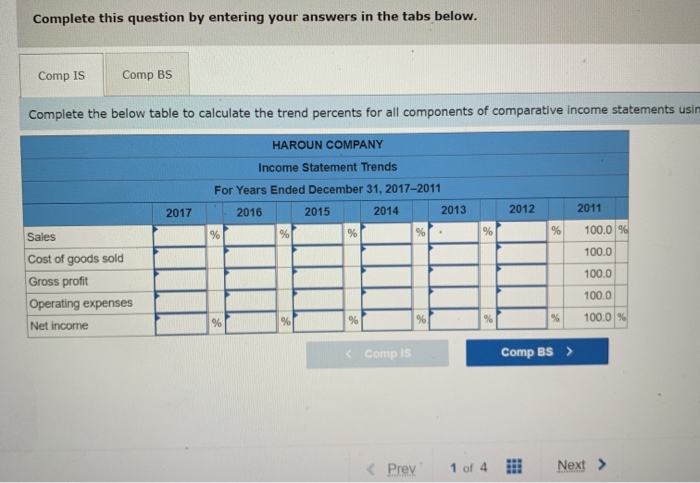
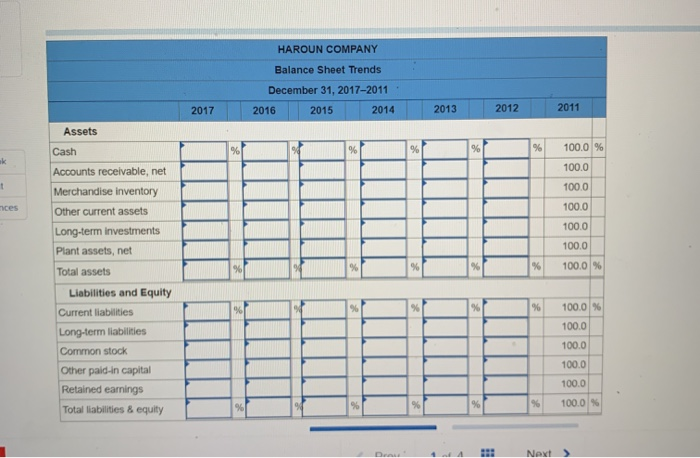 m(s) Saved ($ thousands) Sales Cost of goods sold Gross profit Operating expenses Net income HAROUN COMPANY Comparative Income Statements For Years Ended December 31, 2017-2011 2017 2016 2015 2014 2013 2012 2011 $2,210 $1,936 $1,761 $1,614 $1,506 $1,401 $1,148 1,589 1,293 1,112 973 905 846 674 621643 649 641 601 555 474 473 370 339 250 217 214 178 $ 148 $ 273 $ 310 $ 391 $ 384 $ 341 $ 296 HAROUN COMPANY Comparative Balance Sheets December 31, 2017-2011 2017 2016 2015 2014 2013 2012 2011 $ $ $ $ 82 587 2,122 54 114 428 1,137 119 377 1,021 121 252 629 ($ thousands) Assets Cash Accounts receivable, net Merchandise inventory other current assets Long-term investments Plant assets, net Total assets Liabilities and Equity Current liabilities Long-term liabilities Common stock other paid-in capital Retained earnings Total liabilities and equity $ 108. $ 112 616 558 1,545 1,350 49 0 2,586 2,262 $4,904 $4,312 46 $ 117 357 868 46 167 1,173 $2,728 2,596 $5,441 167 1,277 $3,177 167 1,319 $3,049 167 1,007 $2,200 $ $ $ 754 1,238 000 515 636 332 477 770 770 $1,367 1,461 990 248 1,375 $5,441 $1,150 1,272 990 248 1,244 $4,904 $ 627 575 880 220 875 $3,177 $ 544 587 880 220 818 $3,049 193 1,082 $4,312 193 614 $2,728 428 $2,200 Complete this question by entering your answers in the tabs below. Comp IS Comp BS Complete the below table to calculate the trend percents for all components of comparative income statements usir HAROUN COMPANY Income Statement Trends For Years Ended December 31, 2017-2011 2016 2015 2014 2013 2017 2012 2011 100.0 % Sales 100.0 Cost of goods sold Gross profit Operating expenses Net income 100.0 100.0 100.0 % % HAROUN COMPANY Balance Sheet Trends December 31, 2017-2011 2016 2015 2014 2017 2013 2012 2011 Assets Cash Accounts receivable, net 100.0 % 100.0 100.0 100.0 Merchandise inventory Other current assets Long-term investments Plant assets, net Total assets 100.0 100.0 100.0 % Liabilities and Equity Current liabilities Long-term liabilities Common stock Other paid-in capital Retained earnings Total liabilities & equity 100.0 % 100.0 100.0 100.0 100.0 100.0 % Next >
please help! solve this!
Step by Step Solution
There are 3 Steps involved in it
Step: 1

Get Instant Access to Expert-Tailored Solutions
See step-by-step solutions with expert insights and AI powered tools for academic success
Step: 2

Step: 3
Ace Your Homework with AI
Get the answers you need in no time with our AI-driven, step-by-step assistance
Get Started