Please help!
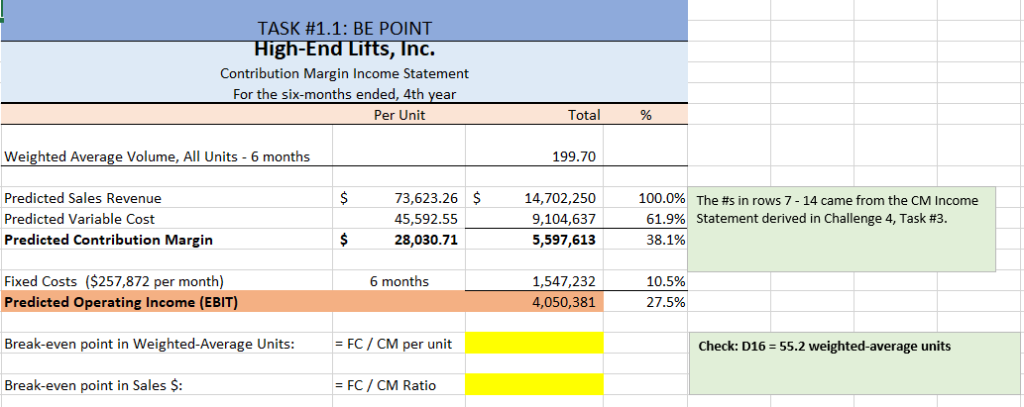
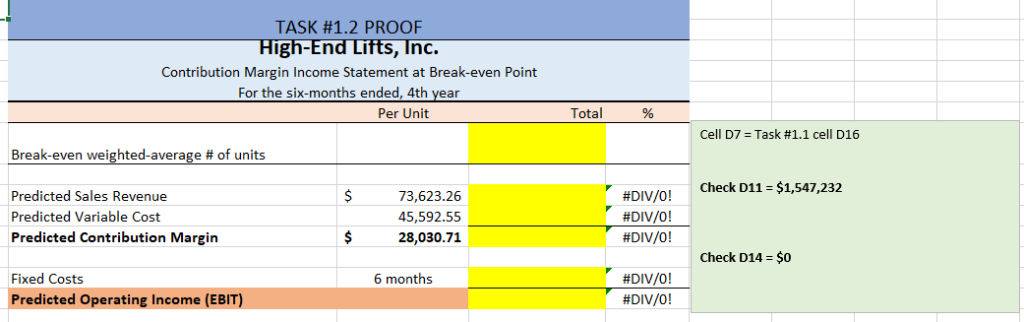
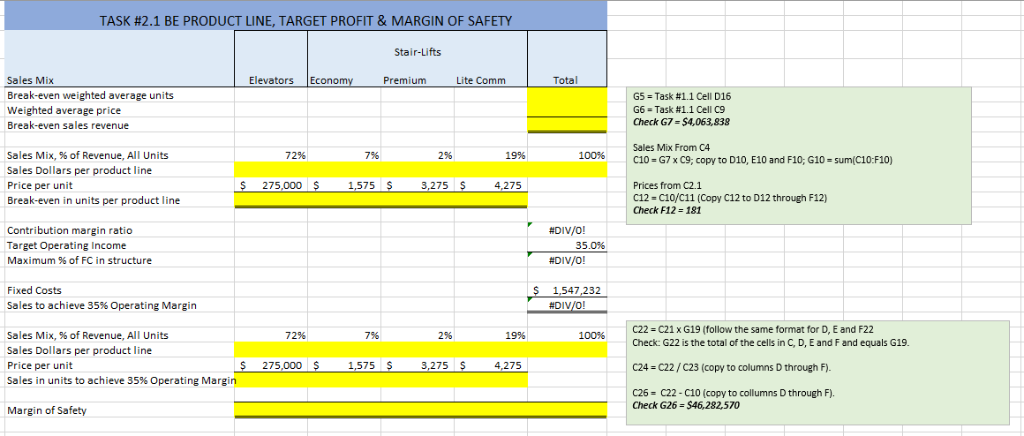
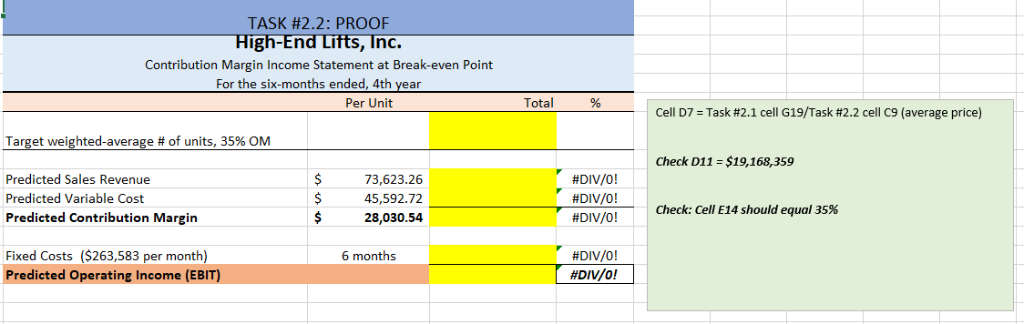
TASK #1.1: BE POINT gh-End Lifts, Inc. Contribution Margin Income Statement For the six-months ended, 4th year Per Unit Total Weighted Average Volume, All Units-6 months 199.70 Predicted Sales Revenue Predicted Variable Cost Predicted Contribution Margin 73,623.26 $ 45,592.55 28,030.71 14,702,250 9,104,637 5,597,613 100.0% 61.9% 38.1% The #s in rows 7-14 came from the CM Income statement derived in Challenge 4, Task #3. Fixed Costs ($257,872 per month) Predicted Operating Income (EBIT) 6 months 1,547,232 4,050,381 10.5% 275% Break-even point in Weighted-Average Units -FC/CM per unit Check: D16-55.2 weighted-average units Break-even point in Sales S: = FC / CM Ratio TASK #1.2 PROOF gh-End Lifts, Inc. Contribution Margin Income Statement at Break-even Point For the six-months ended, 4th year Per Unit Total Cell D7 Task #1.1 cell D16 Break-even weighted-average # of units Check D11 $1,547,232 Predicted Sales Revenue Predicted Variable Cost Predicted Contribution Margin 73,623.26 45,592.55 28,030.71 #DIV/0! #DIV/0! #DIV/0 ! Check D14 $0 Fixed Costs Predicted Operating Income (EBIT) #DIV/0! #DIV/0! 6 months TASK #2.1 BE PRODUCT LINE, TARGET PROFIT & MARGIN OF SAFETY Stair-Lifts Total Sales Mix Break-even weighted average units Weighted average price Break-even sales revenue Elevators Eco Premium Lite Comm G5-Task #1.1 Cell D16 G6 Task #1.1 Cell C9 -Check G7-$4,063,838 Sales Mix From C4 C10 G7x C9; copy to D10, E10 and F10, G10 sum(C10:F10) Sales Mix, % of Revenue, All Units Sales Dollars per product line Price per unit Break-even in units per product line 72% 7% 2% 19% 100% 275,000 1,575 3,275 Prices from C2.1 C12 C10/C11 (Copy C12 to D12 through F12) Check F12 181 4,275 Contribution margin ratio Target Operating Income Maximum % of FC in structure #DIV/O! #DIV/0! 1,547,232 35.0% Fixed Costs Sales to achieve 35% Operating Margin #DIV C22 C21 x G19 (follow the same format for D, E and F22 Sales Mix, % of Revenue, All Units Sales Dollars per product line Price per unit sales in units to achieve 35% Operating Margin 72% 7% 2% 1996 100% Check: G22 is the total of the cells in C, D, E and Fand equals G19. C24 C22/C23 (copy to columns D through F). C26 C22-C10 (copy to collumns D through F). 275,000 1,575 3,275 4,275 Check G26 $46,282,570 Margin of Safety TASK #2.2: PROOF High-End s, Inc. Contribution Margin Income Statement at Break-even Point For the six-months ended, 4th year Per Unit Total Cell D7-Task #2.1 cell G19/Task #2.2 cell C9 (average price) Target weighted-average # of units, 35% OM Check D11 $19,168,359 Predicted Sales Revenue Predicted Variable Cost Predicted Contribution Margin 73,623.26 45,592.72 28,030.54 #DIV/0! #DIV/0! #DIV/0 ! Check: Cell E14 should equal 35% , Fixed Costs ($263,583 per month) Predicted Operating Income (EBIT) #DIV/0! #DIV/ 0! 6 months