

Answered step by step
Verified Expert Solution
Question
1 Approved Answer
please help! thank you! Expected Inflation = Expected Remaining Life in Months at Retirement = Needed per month retirement income (assume annual compounding). FV 40
please help! thank you!
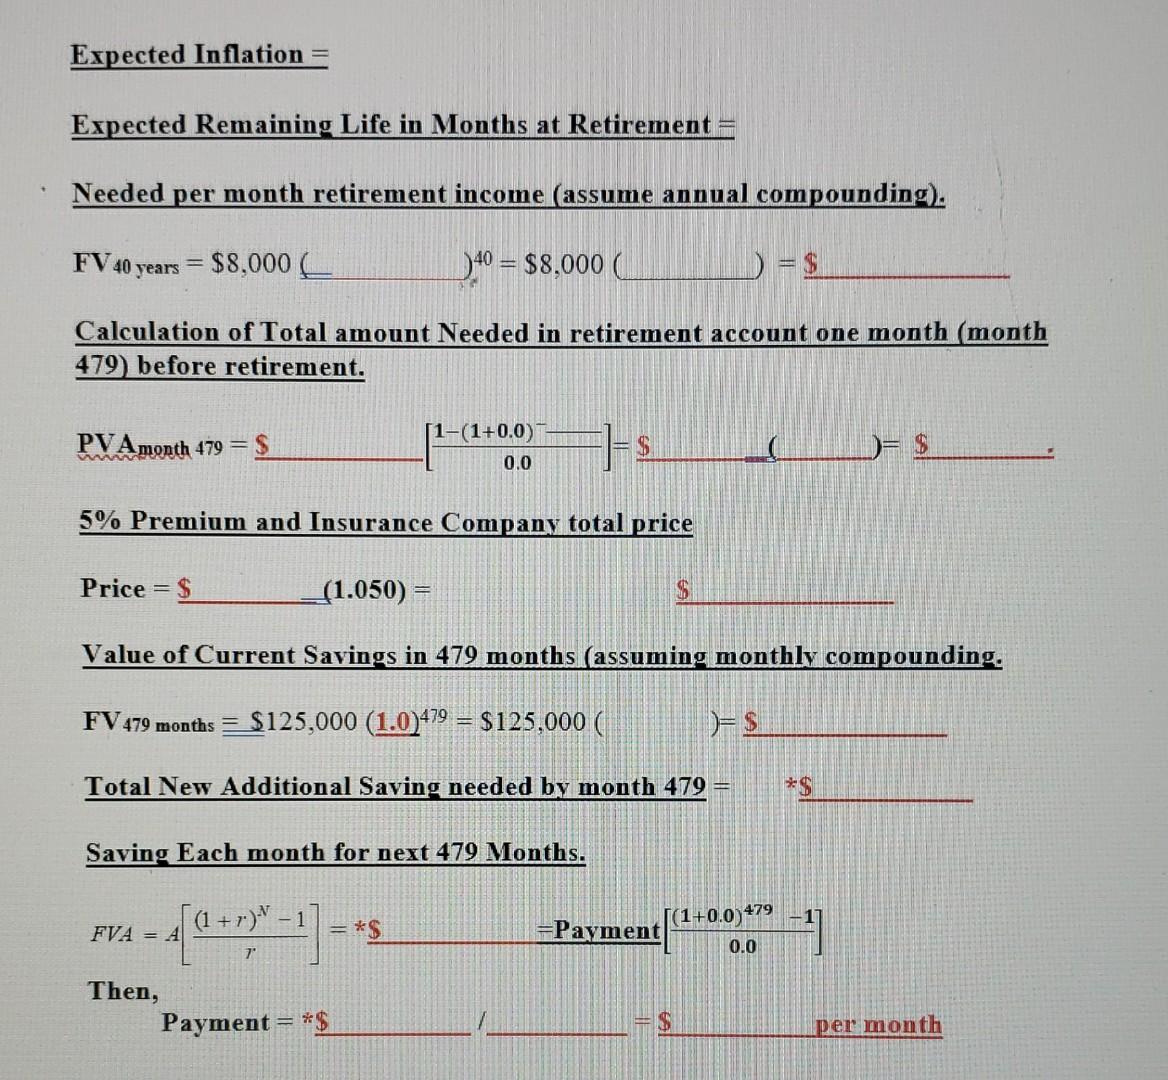
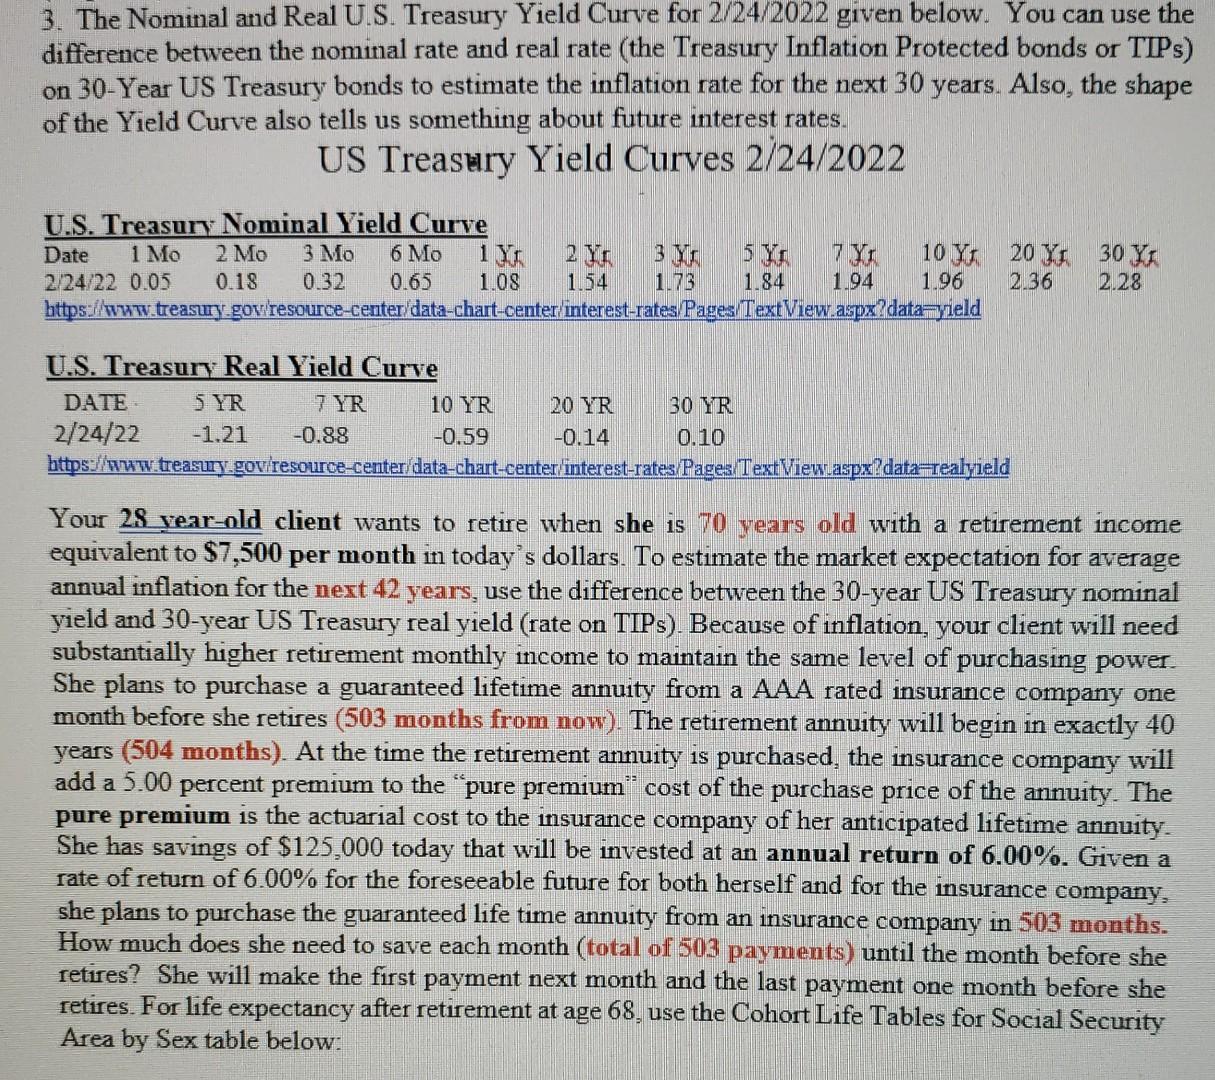
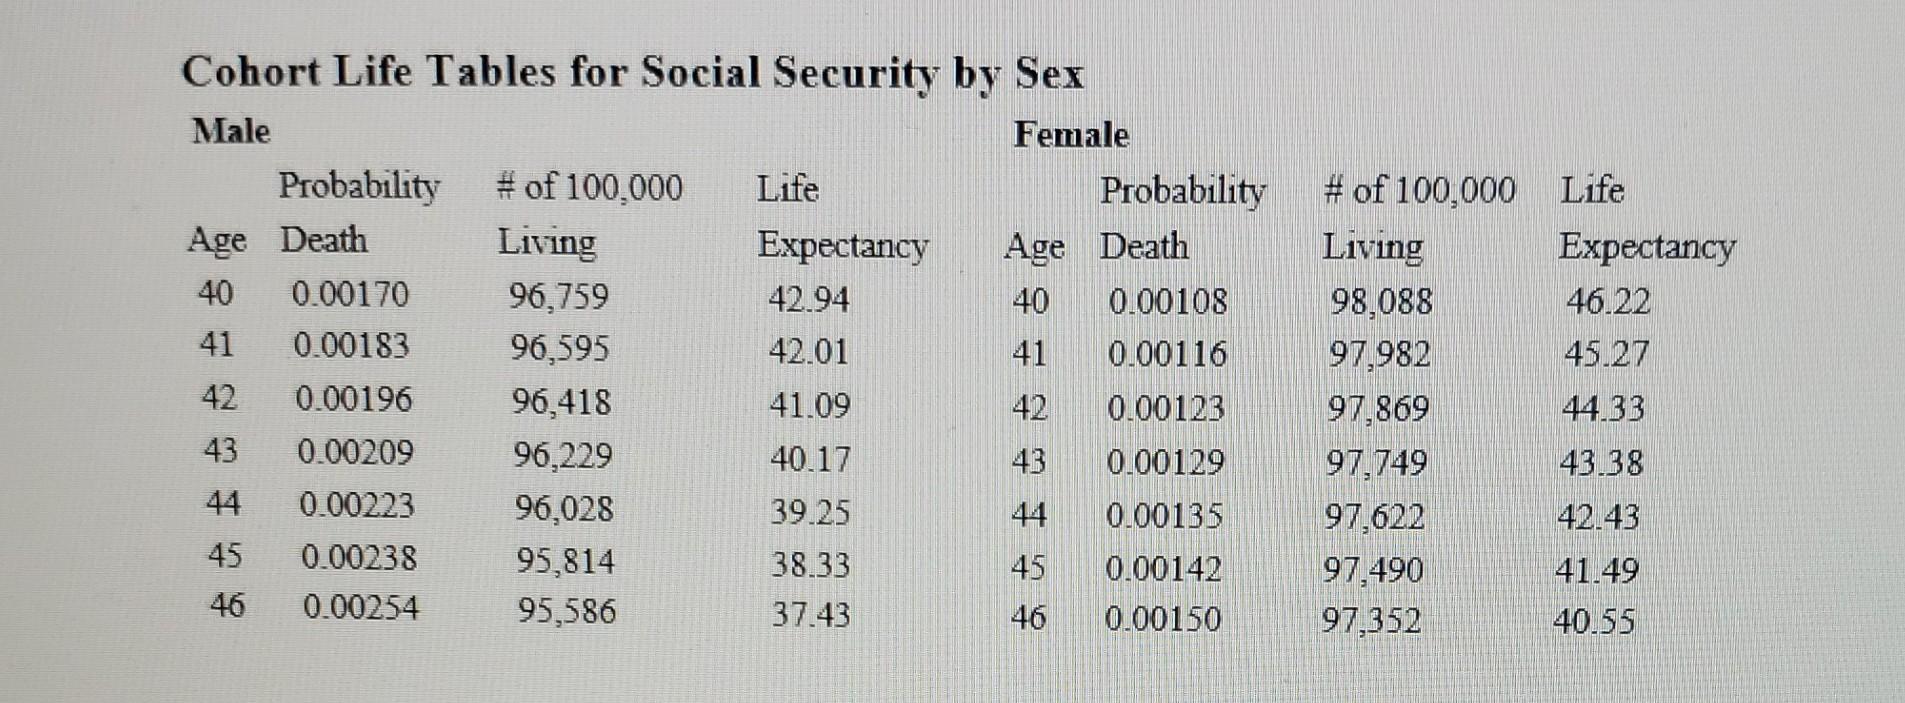
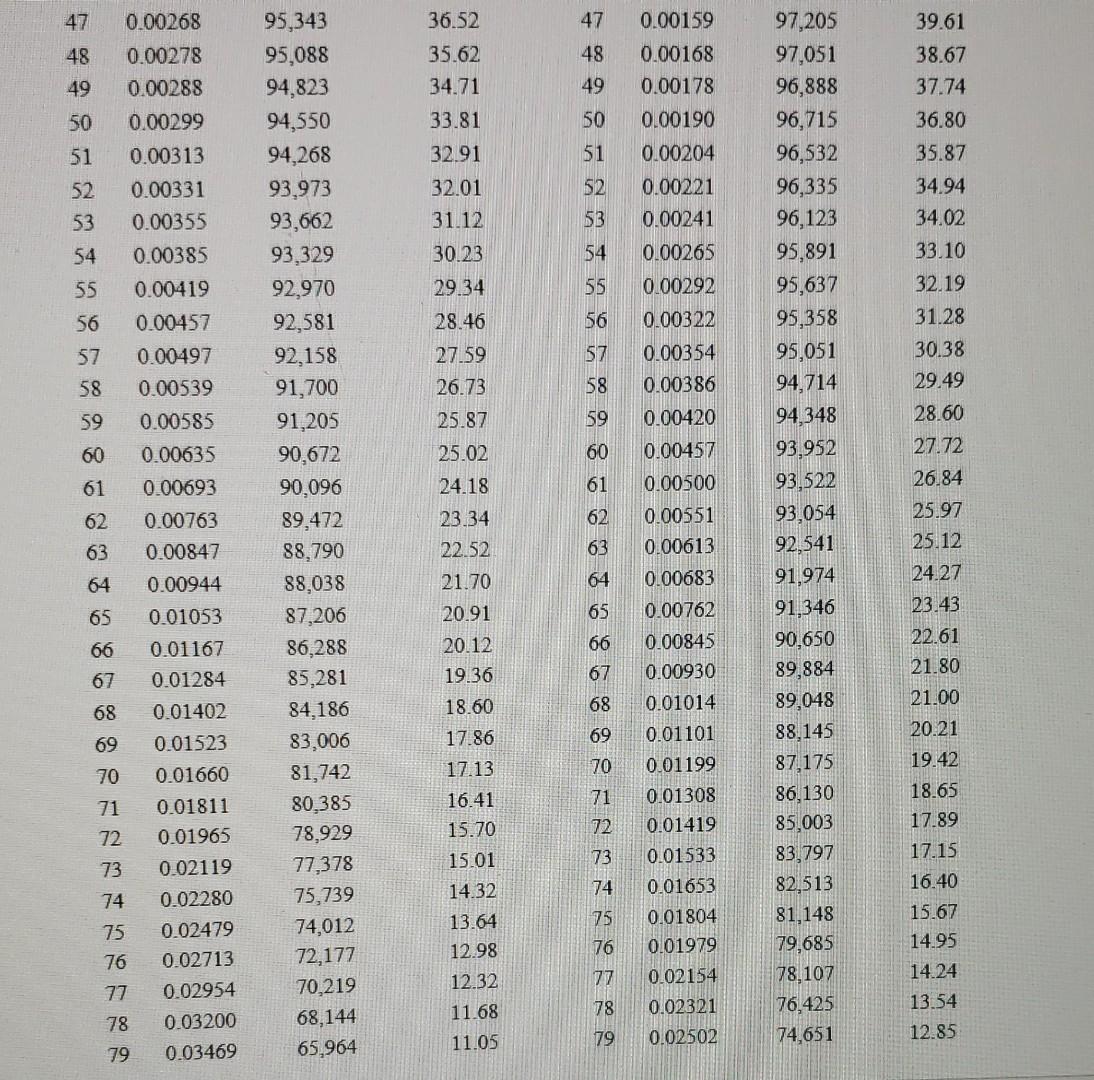
Expected Inflation = Expected Remaining Life in Months at Retirement = Needed per month retirement income (assume annual compounding). FV 40 years = $8,000 )40 = $8,000 1 = $ Calculation of Total amount Needed in retirement account one month (month 479 before retirement. PVAmonth 479 = $ [1-(1+0.0) 0.0 $ 5% Premium and Insurance Company total price Price = $ (1.050) = $ Value of Current Savings in 479 months (assuming monthly compounding. FV 479 months = $125,000 (1.0)479 = $125,000 ( = = $ Total New Additional Saving needed by month 479 = *$ Saving Each month for next 479 Months. [(1 + r) - 1 (1+0.0)479 FVA A [ +1] $ =Payment 0.0 Then, Payment *$ per month 3. The Nominal and Real U.S. Treasury Yield Curve for 2/24/2022 given below. You can use the difference between the nominal rate and real rate (the Treasury Inflation Protected bonds or TIPs) on 30-Year US Treasury bonds to estimate the inflation rate for the next 30 years. Also, the shape of the Yield Curve also tells us something about future interest rates. US Treasury Yield Curves 2/24/2022 U.S. Treasury Nominal Yield Curve Date 1 Mo 2 Mo 3 Mo 6 Mo 18 3 x 5 Y6 7 YI 10 Y 20 Y 30 YA 2/24/22 0.05 0.18 0.32 0.65 1.08 154 1.73 1.84 1.96 2.36 2.28 https://www.treasury.gov/resource-center/data-chart-center/interest-rates/Pages TextView.aspx?data-yield 1.94 U.S. Treasury Real Yield Curve DATE SYR 7 YR 10 YR 20 YR 30 YR 2/24/22 -1.21 -0.88 -0.59 -0.14 0.10 https://www.treasury.gov/resource-center/data-chart-center/interest-rates/Pages TextView.aspx?datarealyield Your 28 vear-old client wants to retire when she is 70 years old with a retirement income equivalent to $7,500 per month in today's dollars. To estimate the market expectation for average annual inflation for the next 42 years, use the difference between the 30-year US Treasury nominal yield and 30-year US Treasury real yield (rate on TIPs). Because of inflation, your client will need substantially higher retirement monthly income to maintain the same level of purchasing power. She plans to purchase a guaranteed lifetime annuity from a AAA rated insurance company one month before she retires (503 months from now). The retirement annuity will begin in exactly 40 years (504 months). At the time the retirement annuity is purchased, the insurance company will add a 5.00 percent premium to the pure premium" cost of the purchase price of the annuity. The pure premium is the actuarial cost to the insurance company of her anticipated lifetime annuity. She has savings of $125,000 today that will be invested at an annual return of 6.00%. Given a rate of return of 6.00% for the foreseeable future for both herself and for the insurance company, she plans to purchase the guaranteed life time annuity from an insurance company in 503 months. How much does she need to save each month (total of 503 payments) until the month before she retires? She will make the first payment next month and the last payment one month before she retires. For life expectancy after retirement at age 68, use the Cohort Life Tables for Social Security Area by Sex table below: Cohort Life Tables for Social Security by Sex Male Female Probability # of 100,000 Life Probability Age Death Living Expectancy Age Death 40 0.00170 96,759 42.94 40 0.00108 41 0.00183 96,595 42.01 41 0.00116 42 0.00196 96,418 41.09 42 0.00123 43 0.00209 96,229 40.17 0.0 44 0.00223 96,028 39.25 44 0.00135 45 0.00238 95,814 38.33 45 0.00142 46 0.00254 95,586 37.43 46 0.00150 # of 100,000 Life Living Expectancy 98,088 46.22 97,982 45.27 97,869 44.33 97,749 43.38 97,622 42.43 97,490 41.49 97,352 40.55 47 47 48 48 49 36.52 35.62 34.71 33.81 32.91 49 50 50 0.00159 0.00168 0.00178 0.00190 0.00204 0.00221 0.00241 51 51 52 53 52 53 54 55 0.00268 0.00278 0.00288 0.00299 0.00313 0.00331 0.00355 0.00385 0.00419 0.00457 0.00497 0.00539 0.00585 0.00635 0.00693 0.00763 0.00847 54 32.01 31.12 30.23 29.34 28.46 27.59 26.73 39.61 38.67 37.74 36.80 35.87 34.94 34,02 33.10 32.19 31.28 30.38 29.49 28.60 27.72 97,205 97,051 96,888 96,715 96,532 96,335 96,123 95,891 95,637 95,358 95,051 94,714 94,348 93,952 93.522 93,054 55 56 0.00265 0.00292 0.00322 0.00354 0.00386 0.00420 56 57 58 57 58 59 25.87 59 60 60 0.00457 61 26.84 0.00500 62 95,343 95,088 94,823 94,550 94,268 93,973 93,662 93,329 92,970 92,581 92,158 91,700 91,205 90,672 90,096 89,472 88,790 88,038 87,206 86,288 85,281 84,186 83,006 81,742 80,385 78,929 77,378 75,739 74,012 72,177 70,219 68,144 65,964 62 63 0.00551 0.00613 63 92.541 64 64 25.97 25.12 24.27 23.43 22.61 21.80 65 65 66 66 67 67 25.02 24.18 23.34 22.52 21.70 20.91 20.12 19.36 18.60 17.86 17.13 16.41 15.70 15.01 14.32 13.64 68 68 69 69 a&SH 595 & g%2229 70 0.00944 0.01053 0.01167 0.01284 0.01402 0.01523 0.01660 0.01811 0.01965 0.02119 0.02280 0.02479 0.02713 0.02954 0.03200 0.03469 70 71 71 0.00683 0.00762 0.00845 0.00930 0.01014 0.01101 0.01199 0.01308 0.01419 0.01533 0.01653 0.01804 0.01979 0.02154 0.02321 0.02502 91,974 91,346 90.650 89,884 89,048 88,145 87,175 86,130 85,003 83,797 82,513 81,148 79,685 78.107 76,425 74,651 72 73 73 21.00 20.21 19.42 18.65 17.89 17.15 16.40 15.67 14.95 14.24 13.54 12.85 74 74 75 75 12.98 76 76 77 12.32 11.68 78 78 79 11.05 79 Expected Inflation = Expected Remaining Life in Months at Retirement = Needed per month retirement income (assume annual compounding). FV 40 years = $8,000 )40 = $8,000 1 = $ Calculation of Total amount Needed in retirement account one month (month 479 before retirement. PVAmonth 479 = $ [1-(1+0.0) 0.0 $ 5% Premium and Insurance Company total price Price = $ (1.050) = $ Value of Current Savings in 479 months (assuming monthly compounding. FV 479 months = $125,000 (1.0)479 = $125,000 ( = = $ Total New Additional Saving needed by month 479 = *$ Saving Each month for next 479 Months. [(1 + r) - 1 (1+0.0)479 FVA A [ +1] $ =Payment 0.0 Then, Payment *$ per month 3. The Nominal and Real U.S. Treasury Yield Curve for 2/24/2022 given below. You can use the difference between the nominal rate and real rate (the Treasury Inflation Protected bonds or TIPs) on 30-Year US Treasury bonds to estimate the inflation rate for the next 30 years. Also, the shape of the Yield Curve also tells us something about future interest rates. US Treasury Yield Curves 2/24/2022 U.S. Treasury Nominal Yield Curve Date 1 Mo 2 Mo 3 Mo 6 Mo 18 3 x 5 Y6 7 YI 10 Y 20 Y 30 YA 2/24/22 0.05 0.18 0.32 0.65 1.08 154 1.73 1.84 1.96 2.36 2.28 https://www.treasury.gov/resource-center/data-chart-center/interest-rates/Pages TextView.aspx?data-yield 1.94 U.S. Treasury Real Yield Curve DATE SYR 7 YR 10 YR 20 YR 30 YR 2/24/22 -1.21 -0.88 -0.59 -0.14 0.10 https://www.treasury.gov/resource-center/data-chart-center/interest-rates/Pages TextView.aspx?datarealyield Your 28 vear-old client wants to retire when she is 70 years old with a retirement income equivalent to $7,500 per month in today's dollars. To estimate the market expectation for average annual inflation for the next 42 years, use the difference between the 30-year US Treasury nominal yield and 30-year US Treasury real yield (rate on TIPs). Because of inflation, your client will need substantially higher retirement monthly income to maintain the same level of purchasing power. She plans to purchase a guaranteed lifetime annuity from a AAA rated insurance company one month before she retires (503 months from now). The retirement annuity will begin in exactly 40 years (504 months). At the time the retirement annuity is purchased, the insurance company will add a 5.00 percent premium to the pure premium" cost of the purchase price of the annuity. The pure premium is the actuarial cost to the insurance company of her anticipated lifetime annuity. She has savings of $125,000 today that will be invested at an annual return of 6.00%. Given a rate of return of 6.00% for the foreseeable future for both herself and for the insurance company, she plans to purchase the guaranteed life time annuity from an insurance company in 503 months. How much does she need to save each month (total of 503 payments) until the month before she retires? She will make the first payment next month and the last payment one month before she retires. For life expectancy after retirement at age 68, use the Cohort Life Tables for Social Security Area by Sex table below: Cohort Life Tables for Social Security by Sex Male Female Probability # of 100,000 Life Probability Age Death Living Expectancy Age Death 40 0.00170 96,759 42.94 40 0.00108 41 0.00183 96,595 42.01 41 0.00116 42 0.00196 96,418 41.09 42 0.00123 43 0.00209 96,229 40.17 0.0 44 0.00223 96,028 39.25 44 0.00135 45 0.00238 95,814 38.33 45 0.00142 46 0.00254 95,586 37.43 46 0.00150 # of 100,000 Life Living Expectancy 98,088 46.22 97,982 45.27 97,869 44.33 97,749 43.38 97,622 42.43 97,490 41.49 97,352 40.55 47 47 48 48 49 36.52 35.62 34.71 33.81 32.91 49 50 50 0.00159 0.00168 0.00178 0.00190 0.00204 0.00221 0.00241 51 51 52 53 52 53 54 55 0.00268 0.00278 0.00288 0.00299 0.00313 0.00331 0.00355 0.00385 0.00419 0.00457 0.00497 0.00539 0.00585 0.00635 0.00693 0.00763 0.00847 54 32.01 31.12 30.23 29.34 28.46 27.59 26.73 39.61 38.67 37.74 36.80 35.87 34.94 34,02 33.10 32.19 31.28 30.38 29.49 28.60 27.72 97,205 97,051 96,888 96,715 96,532 96,335 96,123 95,891 95,637 95,358 95,051 94,714 94,348 93,952 93.522 93,054 55 56 0.00265 0.00292 0.00322 0.00354 0.00386 0.00420 56 57 58 57 58 59 25.87 59 60 60 0.00457 61 26.84 0.00500 62 95,343 95,088 94,823 94,550 94,268 93,973 93,662 93,329 92,970 92,581 92,158 91,700 91,205 90,672 90,096 89,472 88,790 88,038 87,206 86,288 85,281 84,186 83,006 81,742 80,385 78,929 77,378 75,739 74,012 72,177 70,219 68,144 65,964 62 63 0.00551 0.00613 63 92.541 64 64 25.97 25.12 24.27 23.43 22.61 21.80 65 65 66 66 67 67 25.02 24.18 23.34 22.52 21.70 20.91 20.12 19.36 18.60 17.86 17.13 16.41 15.70 15.01 14.32 13.64 68 68 69 69 a&SH 595 & g%2229 70 0.00944 0.01053 0.01167 0.01284 0.01402 0.01523 0.01660 0.01811 0.01965 0.02119 0.02280 0.02479 0.02713 0.02954 0.03200 0.03469 70 71 71 0.00683 0.00762 0.00845 0.00930 0.01014 0.01101 0.01199 0.01308 0.01419 0.01533 0.01653 0.01804 0.01979 0.02154 0.02321 0.02502 91,974 91,346 90.650 89,884 89,048 88,145 87,175 86,130 85,003 83,797 82,513 81,148 79,685 78.107 76,425 74,651 72 73 73 21.00 20.21 19.42 18.65 17.89 17.15 16.40 15.67 14.95 14.24 13.54 12.85 74 74 75 75 12.98 76 76 77 12.32 11.68 78 78 79 11.05 79Step by Step Solution
There are 3 Steps involved in it
Step: 1

Get Instant Access to Expert-Tailored Solutions
See step-by-step solutions with expert insights and AI powered tools for academic success
Step: 2

Step: 3
Ace Your Homework with AI
Get the answers you need in no time with our AI-driven, step-by-step assistance
Get Started
Valuation Measuring and managing the values of companies
Authors: Mckinsey, Tim Koller, Marc Goedhart, David Wessel
5th edition
978-0470424650, 9780470889930, 470424656, 470889934, 978-047042470