Please help to fill out the chart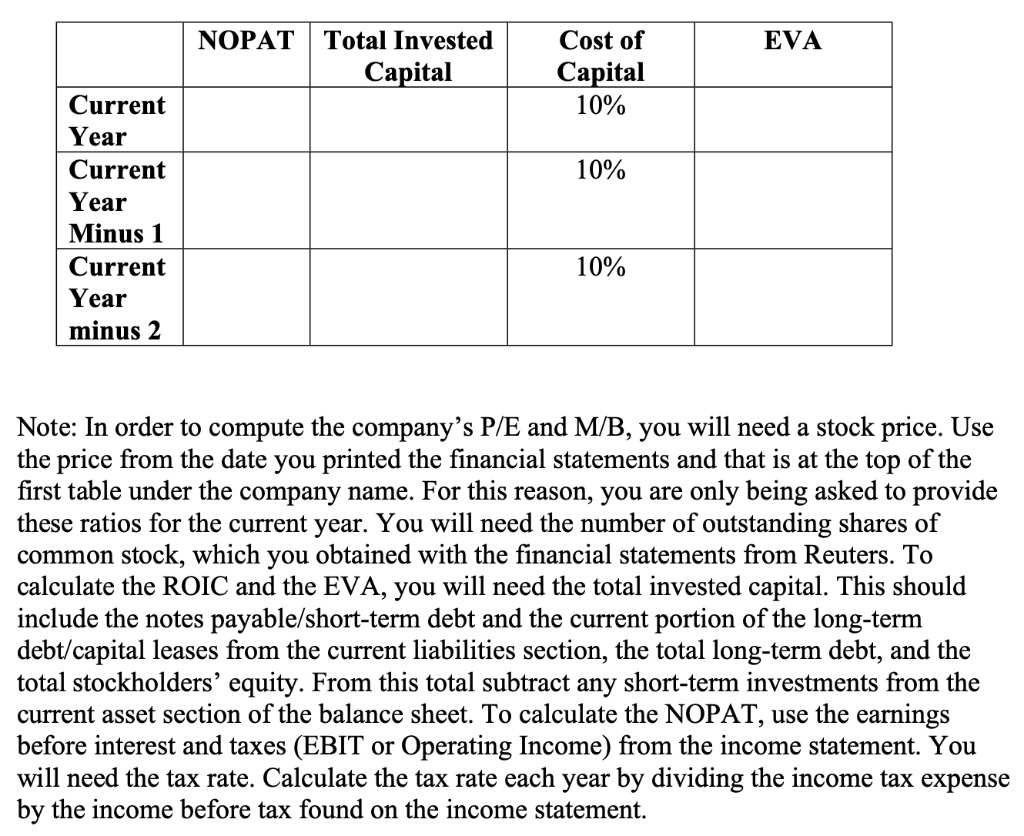
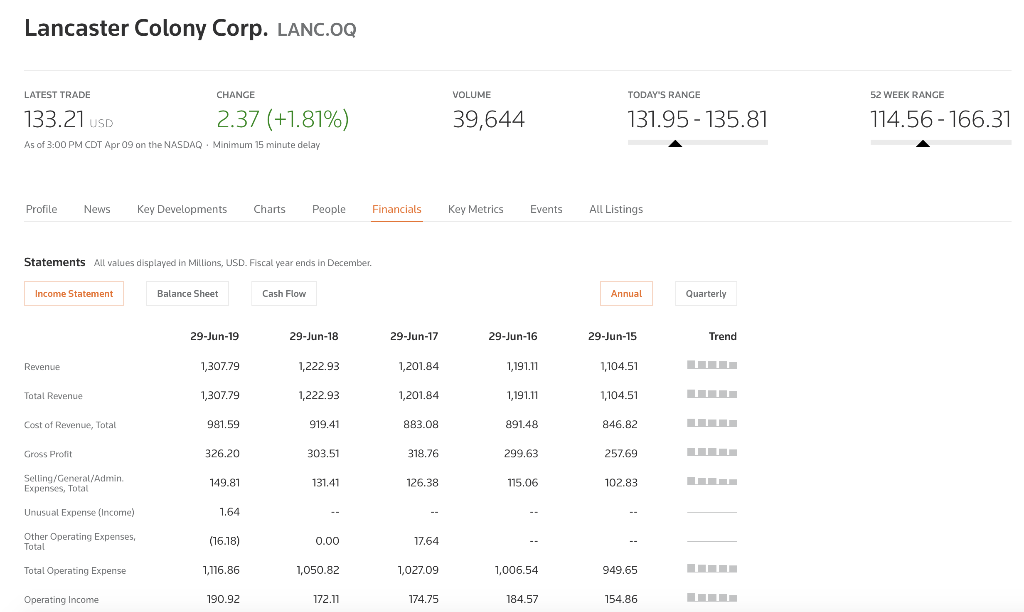
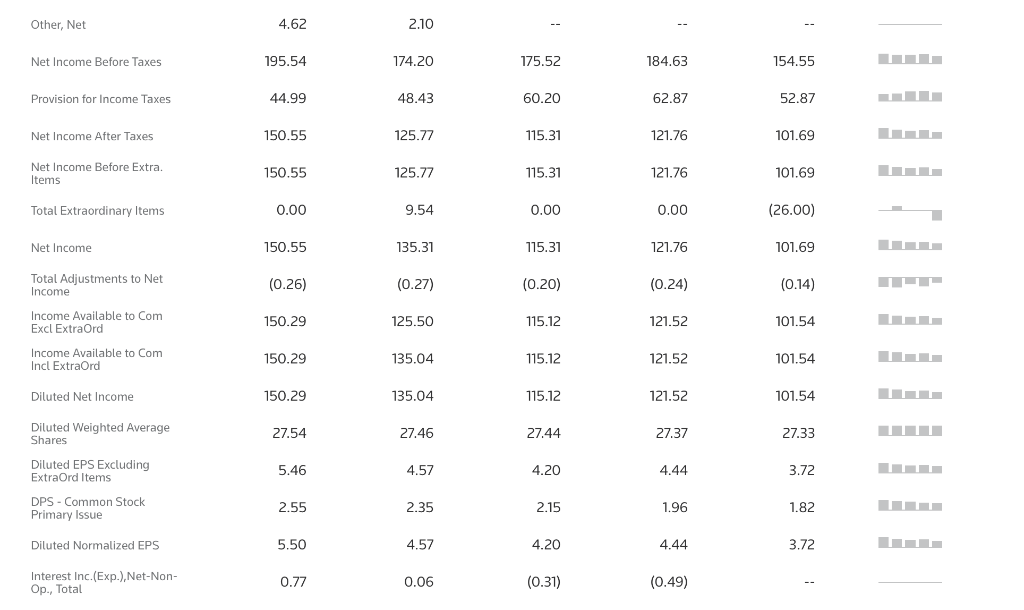
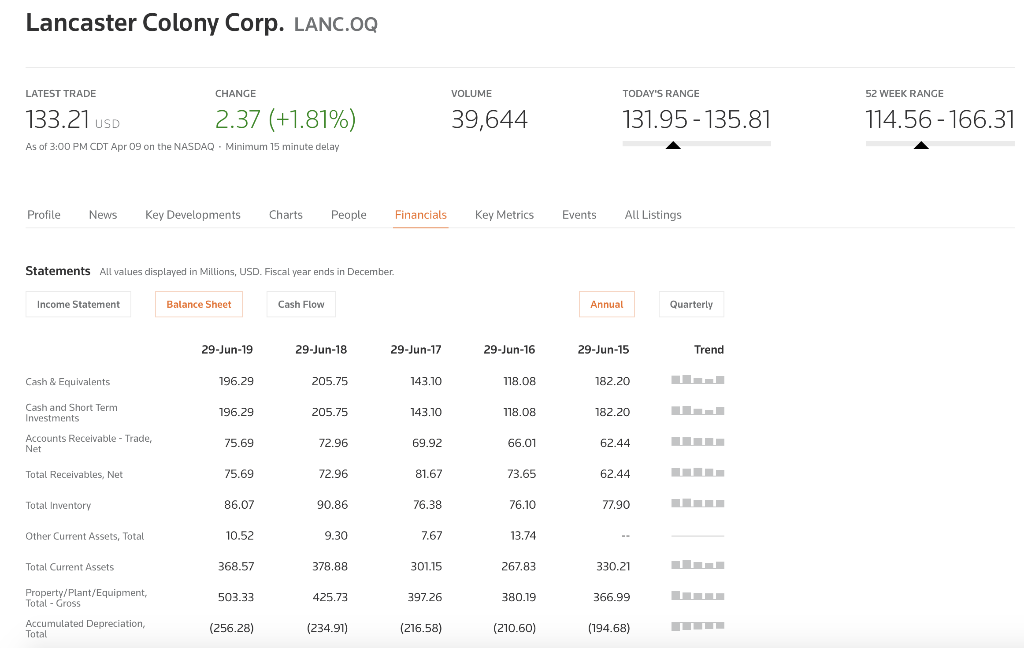
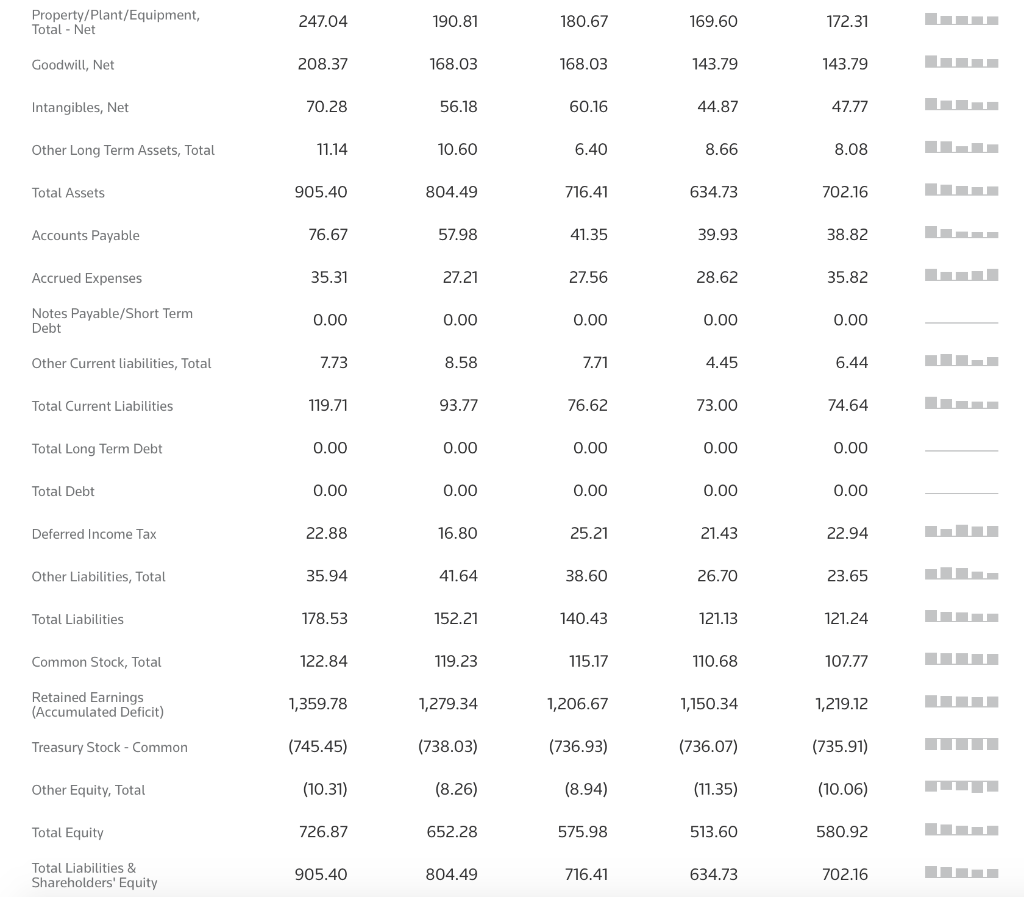

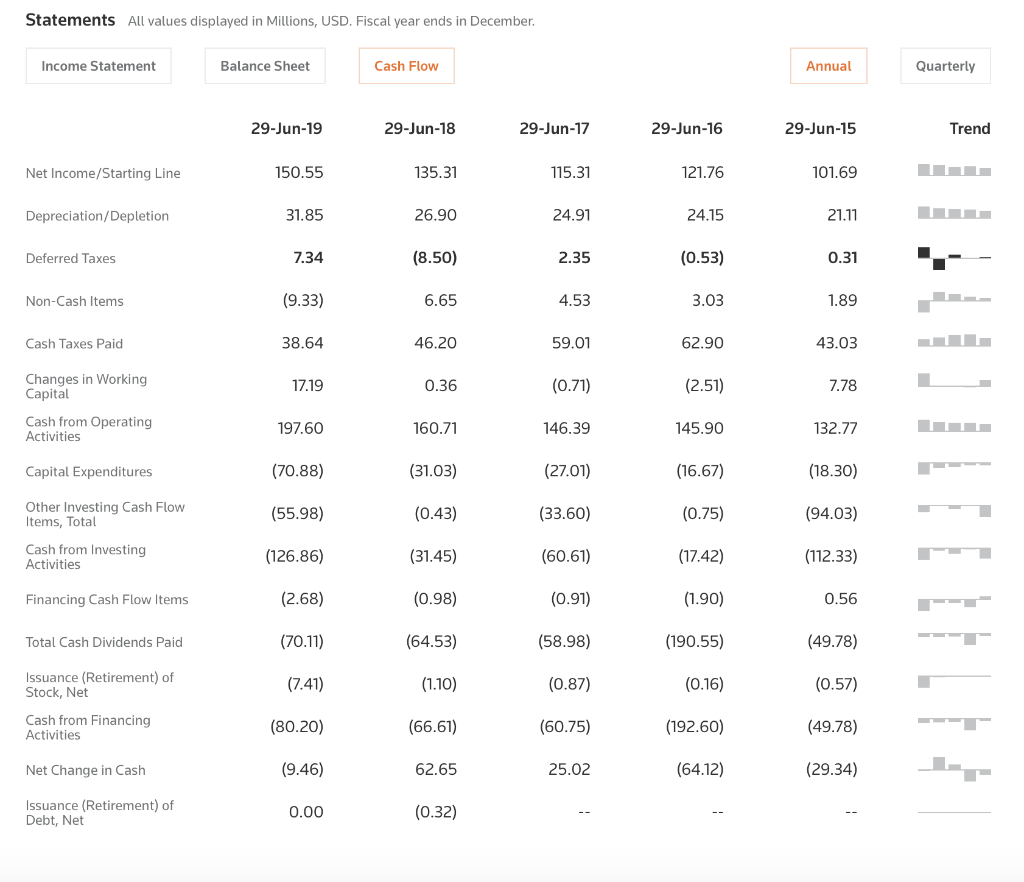
EVA NOPAT | Total Invested Capital Cost of Capital 10% 10% Current Year Current Year Minus 1 Current Year minus 2 10% Note: In order to compute the company's P/E and M/B, you will need a stock price. Use the price from the date you printed the financial statements and that is at the top of the first table under the company name. For this reason, you are only being asked to provide these ratios for the current year. You will need the number of outstanding shares of common stock, which you obtained with the financial statements from Reuters. To calculate the ROIC and the EVA, you will need the total invested capital. This should include the notes payable/short-term debt and the current portion of the long-term debt/capital leases from the current liabilities section, the total long-term debt, and the total stockholders' equity. From this total subtract any short-term investments from the current asset section of the balance sheet. To calculate the NOPAT, use the earnings before interest and taxes (EBIT or Operating Income) from the income statement. You will need the tax rate. Calculate the tax rate each year by dividing the income tax expense by the income before tax found on the income statement. Lancaster Colony Corp. LANC.OQ VOLUME LATEST TRADE CHANGE 133.21 USD 2.37 (+1.81%) As of 3:00 PM CDT Apr 09 on the NASDAQ. Minimum 15 minute delay TODAY'S RANGE 131.95 - 135.81 131 .95-135.81 52 WEEK RANGE 114.56-166.31 39,644 14:58 - 16.31 Profile News Key Developments Charts People Financials Key Metrics Events All Listings Statements All values displayed in Millions, USD. Fiscal year ends in December. Income Statement Balance Sheet Cash Flow Annual Quarterly 29-Jun-19 29-Jun-18 29-Jun-17 29-Jun-16 29-Jun-15 Trend Revenue 1,307.79 1,222.93 1,201.84 1,191.11 1,104.51 Total Revenue 1,307.79 1,222.93 1,201.84 1,191.11 1,104.51 Cost of Revenue, Total 981.59 919.41 883.08 891.48 846.82 Gross Profit 326.20 303.51 318.76 299.63 257.69 Selling/General/Admin Expenses, Total 149.81 126.38 102.83 Unusual Expense (Income) 1.64 Other Operating Expenses, Total (16.18) 0.00 17.64 Total Operating Expense 1,116.86 1,050.82 1,027.09 1,006.54 949.65 Operating Income 190.92 172.11 174.75 184.57 154.86 Other, Net 4.62 2.10 Net Income Before Taxes 195.54 174.20 175.52 184.63 154.55 Provision for Income Taxes 44.99 48.43 60.20 62.87 52.87 Net Income After Taxes 150.55 125.77 115.31 121.76 101.69 Net Income Before Extra. Items 150.55 125.77 115.31 121.76 101.69 Total Extraordinary Items 0.00 9.54 0.00 0.00 (26.00) Net Income 150.55 135.31 115.31 121.76 101.69 Total Adjustments to Net Income (0.26) (0.20) (0.24) (0.14) (0.27) 125.50 150.29 115.12 121.52 101.54 Income Available to Com Excl Extraord Income Available to Com Incl Extraord 150.29 135.04 115.12 121.52 101.54 Diluted Net Income 150.29 135.04 115.12 121.52 101.54 Diluted Weighted Average Shares 27.54 27.46 27.44 27.37 27.33 Diluted EPS Excluding ExtraOrd Items 5.46 4.57 4.20 4.44 3.72 DPS - Common Stock Primary Issue 2.55 2.35 2.15 1.96 1.82 Diluted Normalized EPS 5.50 in 4.20 4.44 2,19 Interest Inc. (Exp.), Net-Non- Op., Total 0.77 0.06 (0.31) (0.49) Lancaster Colony Corp. LANC.OQ LATEST TRADE VOLUME TODAY'S RANGE 52 WEEK RANGE 133.21 USD CHANGE 2.37 (+1.81% 39,644 131.95 - 135.81 114.56-166.31 As of 3:00 PM CDT Apr 09 on the NASDAQ . Minimum 15 minute delay Profile News Key Developments Charts People Financials Key Metrics Events All Listings Statements All values displayed in Millions, USD. Fiscal year ends in December Income Statement Balance Sheet Cash Flow Annual Quarterly 29-Jun-19 29-Jun-18 29-Jun-17 29-Jun-16 29-Jun-15 Trend Cash & Equivalents 196.29 205.75 143.10 118.08 182.20 Cash and Short Term Investments 196.29 205.75 143.10 118.08 182.20 Accounts Receivable - Trade, 75.69 72.96 69.92 66.01 62.44 Net Total Receivables, Net 75.69 72.96 81.67 73.65 62.44 Total Inventory 86.07 90.86 76.38 76.10 77.90 Other Current Assets, Total 10.52 9.30 7.67 13.74 Total Current Assets 368.57 378.88 301.15 267.83 330.21 503.33 425.73 397.26 380.19 366.99 Property/Plant/Equipment, Total - Gross Accumulated Depreciation, Total (256.28) (234.91) (216.58) (210.50) (194.68) Property/Plant/Equipment, Total - Net 247.04 190.81 180.67 169.60 172.31 Goodwill, Net 208.37 168.03 168.03 143.79 143.79 Intangibles, Net 70.28 56.18 60.16 44.87 47.77 Other Long Term Assets, Total 11.14 10.60 6.40 8.66 8.08 Total Assets 905.40 804.49 716.41 634.73 702.16 Accounts Payable 76.67 57.98 41.35 39.93 38.82 Accrued Expenses 35.31 27.21 27.56 28.62 35.82 Notes Payable/Short Term Debt 0.00 0.00 0.00 0.00 0.00 Other Current liabilities, Total 7.73 8.58 7.71 4.45 6.44 Total Current Liabilities 119.71 93.77 76.62 73.00 74.64 Total Long Term Debt 0.00 0.00 0.00 0.00 0.00 Total Debt 0.00 0.00 0.00 0.00 0.00 Deferred Income Tax 22.88 16.80 25.21 21.43 22.94 Other Liabilities, Total 35.94 41.64 38.60 26.70 23.65 Total Liabilities 178.53 152.21 140.43 121.13 121.24 Common Stock, Total 122.84 119.23 115.17 110.68 107.77 Retained Earnings (Accumulated Deficit) 1,359.78 1,279.34 1,206.67 1,150.34 1,219.12 Treasury Stock - Common (745.45) (738.03) (736.93) (736.07) (735.91) Other Equity, Total (10.31) (8.26) (8.94) (11.35) (10.06) Total Equity 726.87 652.28 575.98 513.60 580.92 Total Liabilities & Shareholders' Equity 905.40 804.49 716.41 634.73 702.16 Total Common Shares Outstanding 27.49 27.49 27.45 27.42 27.36 Tangible Book Value per Share, Common Eq 16.30 15.57 12.67 11.85 14.23 Prepaid Expenses 9.69 Statements All values displayed in Millions, USD. Fiscal year ends in December Income Statement Balance Sheet Cash Flow Annual Quarterly 29-Jun-19 29-Jun-18 29-Jun-17 29-Jun-16 29-Jun-15 Trend Net Income/Starting Line 150.55 135.31 115.31 121.76 101.69 Depreciation/Depletion 31.85 26.90 24.91 24.15 21.11 - Deferred Taxes 7.34 (8.50) 2.35 (0.53) 0.31 Non-Cash Items (9.33) 6.65 4.53 3.03 1.89 Cash Taxes Paid 38.64 46.20 59.01 62.90 43.03 - 17.19 0.36 (0.71) (2.51) 7.78 Changes in Working Capital Cash from Operating Activities 197.60 160.71 146.39 145.90 132.77 - Capital Expenditures (70.88) (31.03) (27.01) (16.67) (18.30) Other Investing Cash Flow Items, Total (55.98) (0.43) (33.60) (0.75) (94.03) Cash from Investing Activities (126.86) (31.45) (60.61) (17.42) (112.33) L Financing Cash Flow Items (2.68) (0.98) (0.91) (1.90) 0.56 L Total Cash Dividends Paid (70.11) (64.53) (58.98) (190.55) (49.78) Issuance (Retirement) of Stock, Net (7.41) (1.10) (0.87) (0.16) (0.57) Cash from Financing Activities (80.20) (66.61) (60.75) (192.60) (49.78) (9.46) Net Change in Cash 62.65 25.02 (64.12) 129.34) Issuance (Retirement) of Debt, Net 0.00 (0.32)