please help with bio stats
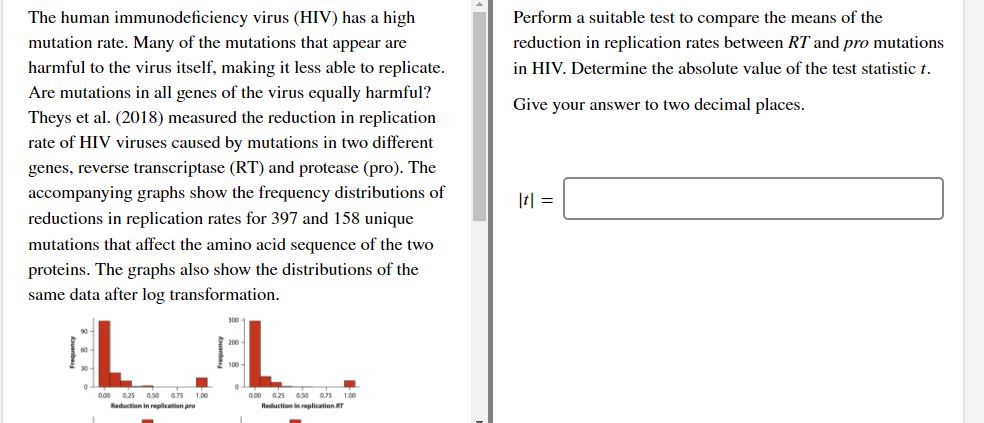
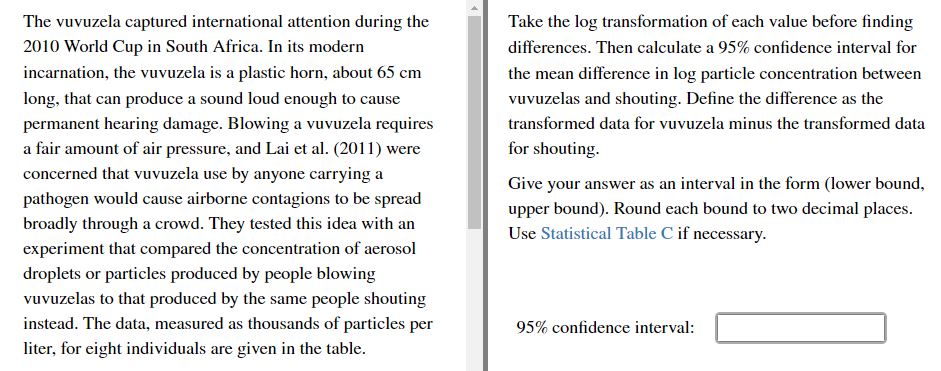
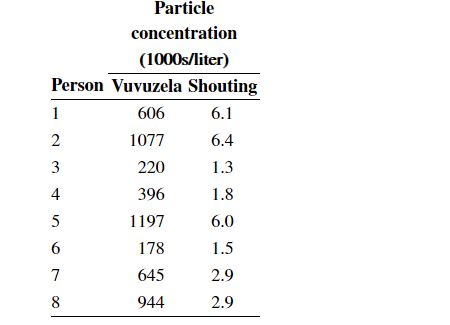
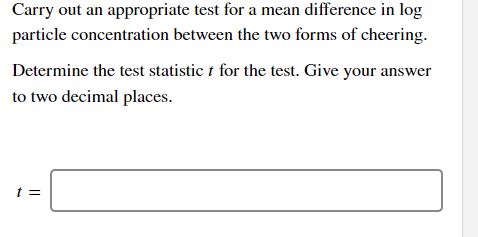
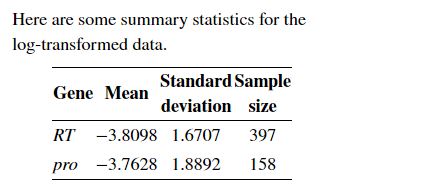
The human immunodeciency virus (HIV) has a high mutation rate. Many of the mutations that appear are harmful to the virus itself. making it less able to replicate. Are mutations in all genes of the virus equally harmful? Theys et al. (2018) measured the reduction in replication rate of HIV viruses caused by mutations in two different genes. reverse transcriptase (RT) and protease (pro). The accompanying graphs show the frequency distributions of reductions in replication rates for 39? and 153 unique mutations that a'ect the amino acid sequence of the two proteins. The graphs also show the distributions of the same data after log transformation. I\" no I l\" n n ID) 1- H'r'l- I 1--- milieu Il maaanntsln Hump-up- mi\"! Perform a suitable test to compare the means of the reduction in replication rates between RT and pro mutations in HIV. Determine the absolute value of the test statistic 1. Give your answer to two decimal places. The vuvuzela captured international attention during the 201C! World Cup in South Africa. In its modern incarnation, the vuvuzela is a plastic horn, about 65 cm long, that can produce a soqu loud enough to cause permanent hearing damage. Blowing a vuvuzela requires a fair amount of air pressure, and Lai et al. (201 l) were concerned that vuvuzela use by anyone carrying a pathogen would cause airborne contagious to be spread broadly through a crowd. They tested this idea with an experiment that compared the concentration of aerosol droplets or particles produced by people blowing vuvuzelas to that produced by the same people shouting instead. The data, measured as thousands of particles per liter, for eight individuals are given in the table. Take the log transformation of each value before nding differences. Then calculate a 95% condence interval for the mean difference in log particle concentration between vuvuzelas and shouting. Dene the difference as the transformed data for vuvuzela minus the transformed data for shouting. Give your answer as an interval in the form (lower bound, upper bound). Round each bound to two decimal places. Use Statistical Table C if necessary. 95% condence interval: : Particle concentration (1000s/liter) Person Vuvuzela Shouting 606 6.1 1077 6.4 220 1.3 396 1.8 1197 6.0 178 1.5 645 2.9 944 2.9Carry out an appropriate test for a mean difference in log particle concentration between the two forms of cheering. Determine the test statistic f for the test. Give your answer to two decimal places. 1 =\f