Answered step by step
Verified Expert Solution
Question
1 Approved Answer
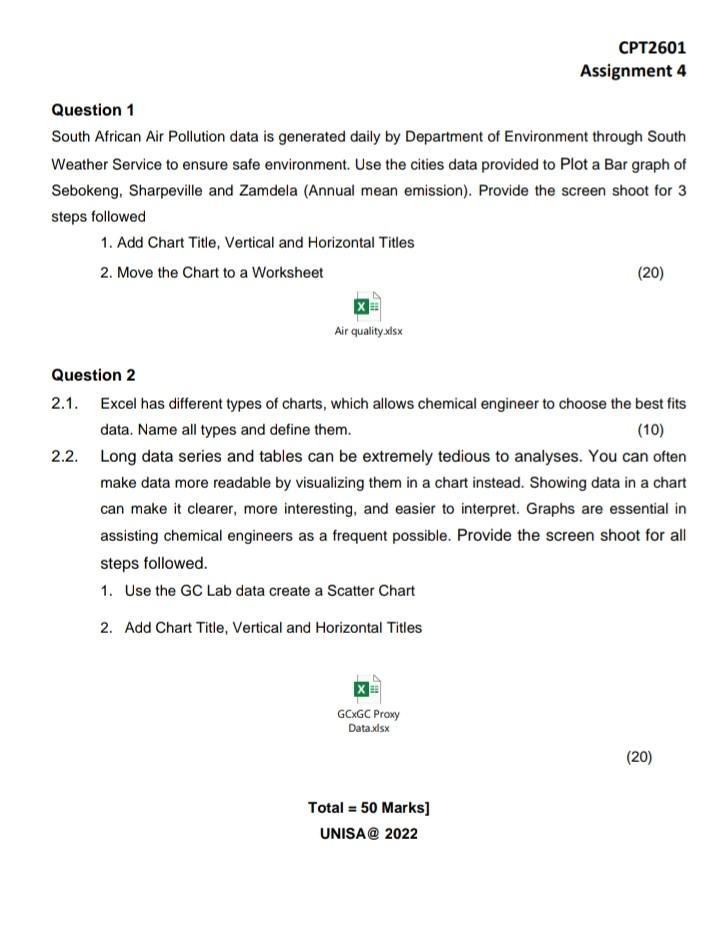
please help with both questions for question1 for question 2 CPT2601 Assignment 4 Question 1 South African Air Pollution data is generated daily by Department

please help with both questions

for question1

for question 2
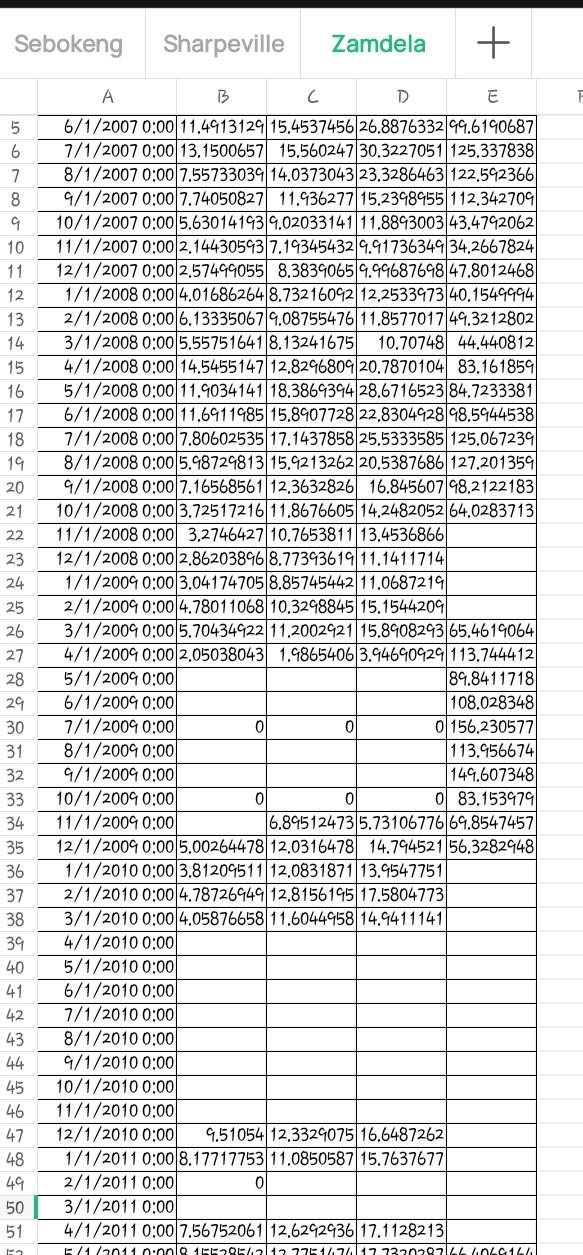
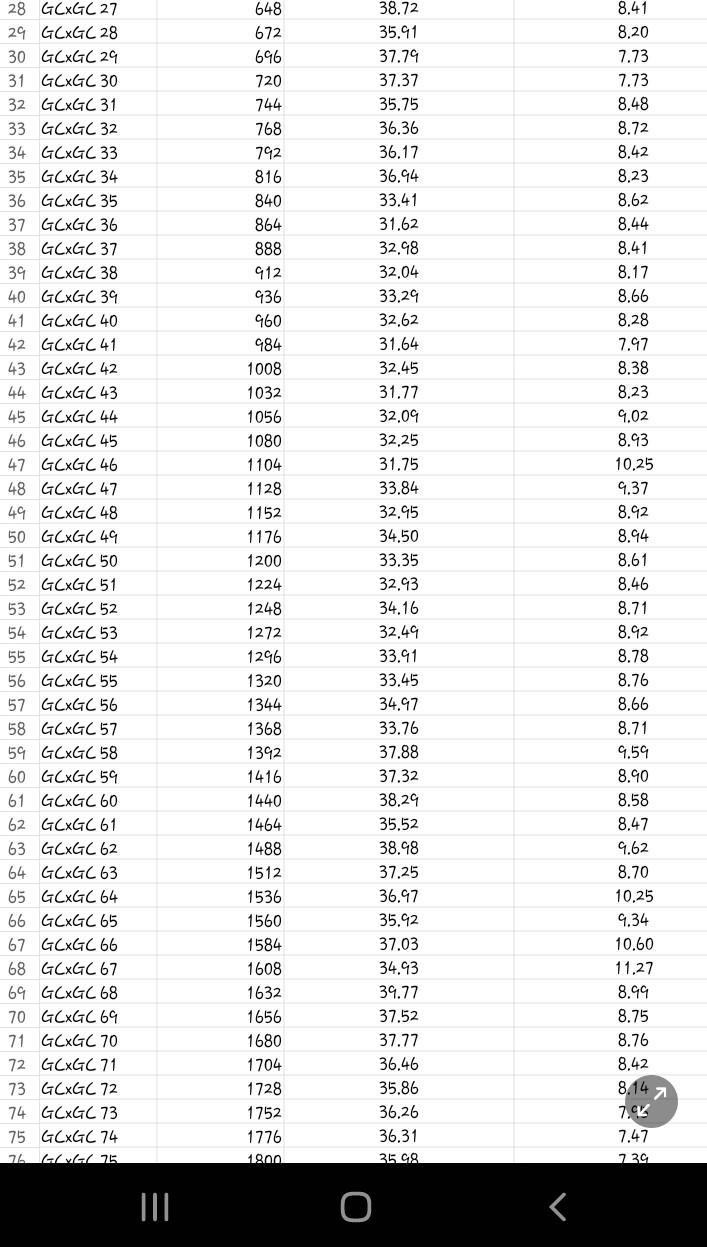
CPT2601 Assignment 4 Question 1 South African Air Pollution data is generated daily by Department of Environment through South Weather Service to ensure safe environment. Use the cities data provided to Plot a Bar graph of Sebokeng, Sharpeville and Zamdela (Annual mean emission). Provide the screen shoot for 3 steps followed 1. Add Chart Title, Vertical and Horizontal Titles 2. Move the Chart to a Worksheet (20) Air quality.xlsx Question 2 2.1. Excel has different types of charts, which allows chemical engineer to choose the best fits data. Name all types and define them. (10) 2.2. Long data series and tables can be extremely tedious to analyses. You can often make data more readable by visualizing them in a chart instead. Showing data in a chart can make it clearer, more interesting, and easier to interpret. Graphs are essential in assisting chemical engineers as a frequent possible. Provide the screen shoot for all steps followed. 1. Use the GC Lab data create a Scatter Chart 2. Add Chart Title, Vertical and Horizontal Titles GOXGC Proxy Dataxdsx (20) Total = 50 Marks] UNISA@ 2022 Sebokeng Sharpeville Zamdela + F T 5 6 7 8 9 10 11 12 13 14. 15 16 17 18 19 20 21 22 23 24 25 26 27 28 29 30 31 32 33 34 35 36 37 38 39 40 41 42 43 44 45 46 47 48 49 50 51 B B C D E 6/1/2007 0:00 11.4913129 15.4537456 26.887633249.6140687 7/1/2007 0:00 13.1500657 15.560247 30.3227051 125.337838 8/1/2007 0:00 7.55733039 14.0373043 23.3286463122.592366 9/1/2007 0:00 7.74050827 11.436277 15,2348455 112.342709 10/1/2007 0:00 5.630141934.02033141 11.8843003 43.4742062 11/1/2007 0:00 2.14430543 7.14345432 9.91736349 34.2667824 12/1/2007 0:00 2.57494055 8.3834065 4.44687648 47.8012468 1/1/2008 0:00 4.01686264 8.73216092 12.2533473 40.1549994 2/1/2008 0:00 6.13335067 9.08755476 11.8577017 49.3212802 3/1/2008 0:00 5.55751641 8.13241675 10.70748 44.440812 4/1/2008 0:00 14.5455147 12.8296809 20.7870104 83.161854 5/1/2008 0:00 11.9034141 18.3864394 28.671652384.7233381 6/1/2008 0:00 11.6911985 15.8907728 22.8304928 48.5444538 7/1/2008 0:00 7.80602535 17.1437858 25.5333585 125.067239 8/1/2008 0:00 5.48724813 15.4213262 20.5387686 127.201359 9/1/2008 0:00 7.16568561 12.3632826 16.845607 48.2122183 10/1/2008 0:00 3.72517216 11.8676605 14,248205264.0283713 11/1/2008 0:00 3.2746427 10.765381113.4536866 12/1/2008 0:00 2.86203846 8.7734361911.1411714 1/1/2009 0:00 3.04174705 8.85745442 11.0687219 2/1/2009 0:00 4.78011068 10.3248845 15.1544204 3/1/2009 0:00 5.70434922 11.200242115.840829365.4619064 4/1/2009 0:00 2.05038043 1.4865406 3.94640429 113.744412 5/1/2009 0:00 89.8411718 6/1/2009 0:00 108.028348 7/1/2004 0:00 0 0 0 0 156.230577 8/1/2009 0:00 113.956674 9/1/2004 0:00 149.607348 10/1/2009 0:00 0 0 0 83.153479 11/1/2009 0:00 6.845124735.7310677664.8547457 12/1/2009 0:00 5.00264478 12.0316478 14.794521 56.3282948 1/1/2010 0:00 3.81204511 12.0831871 13.4547751 2/1/2010 0:00 4.78726449 12.8156145 17.5804773 3/1/2010 0:00 4.05876658 11.6044958 14.9411141 4/1/2010 0:00 5/1/2010 0:00 6/1/2010 0:00 7/1/2010 0:00 8/1/2010 0:00 9/1/2010 0:00 10/1/2010 0:00 11/1/2010 0:00 12/1/2010 0:00 9.51054 12.3329075 16.6487262 1/1/2011 0:00 8.17717753 11.0850587 15.7637677 2/1/2011 0:00 3/1/2011 0:00 4/1/2011 0:00 7.56752061 12.6242436 17.1128213 0 F/4/2014 0.nolo EEQ-427761771 177220207LLLLCLA 648 672 646 720 744 768 38.72 35.91 37.74 37.37 35.75 36.36 36.17 36.94 33.41 31.62 32.98 792 8.41 8.20 7.73 7.73 8.48 8.72 8.42 8.23 8.62 8.44 8.41 8.17 8.66 32.04 33,29 32.62 8.28 28 GCXGC27 29 GCXGC 28 30 GCXGC 29 31 GAGC 30 32 (Cac 31 33 Cac 32 34 GCXGC 33 35 CXGC 34 36 Camc 35 37 Camc 36 38 qCxc 37 3 GCAC 38 40 Camc 3 41 Camc 40 42 GCXGC 41 43 GCXGC 42 44 GCXGC 43 45 GCXGC 44 46 Camc 45 47 GCG46 48 Gxqc47 49 GCXGC 48 50 GZxqc 4 51 GCNG 50 52 Cx51 53 CXGC 52 54 qCxg53 55 GCXGC 54 56 Gx ( 55 57 GAG 56 58 Cx57 5 GCNG 58 60 CGC 5 61 Gx 60 62 GCXGC 61 63 GCXGC 62 64 Gx (63 65 GCXGC 64 66 GCXGC 65 67 GCXGC 66 68 GCxC67 6 GCXGC 68 70 x 6% 71 70x70 70 72 GCXGC 71 73 GCXGC 72 74 GCXGC 73 75 GCXGC 74 72 LVL 75 816 840 864 888 912 436 960 484 1008 1032 1056 1080 1104 1128 1152 1176 1200 1224 1248 1272 1296 1320 1344 1368 1342 1416 1440 1464 1488 1512 1536 1560 1584 1608 1632 1656 1680 1704 1728 1752 1776 1800 31.64 32.45 31.77 32.09 32,25 31.75 33.84 32.95 34.50 33.35 32.93 34.16 32.49 33.41 33.45 34.47 33.76 37.88 37.32 38.29 35.52 38.98 37.25 36.97 7.47 8.38 8.23 9.02 8.43 10.25 4.37 8.92 8.94 8.61 8.46 8.71 8.92 8.78 8.76 8.66 8.71 4.59 8.90 8.58 8.47 4.62 8.70 10.25 4.34 10.60 11.27 8.99 35.92 37.03 34.93 34.77 37.52 37.77 36.46 35.86 36.26 36.31 25.98 8.75 8.76 8.42 8.147 7.6% 7.47 734 TIL O CPT2601 Assignment 4 Question 1 South African Air Pollution data is generated daily by Department of Environment through South Weather Service to ensure safe environment. Use the cities data provided to Plot a Bar graph of Sebokeng, Sharpeville and Zamdela (Annual mean emission). Provide the screen shoot for 3 steps followed 1. Add Chart Title, Vertical and Horizontal Titles 2. Move the Chart to a Worksheet (20) Air quality.xlsx Question 2 2.1. Excel has different types of charts, which allows chemical engineer to choose the best fits data. Name all types and define them. (10) 2.2. Long data series and tables can be extremely tedious to analyses. You can often make data more readable by visualizing them in a chart instead. Showing data in a chart can make it clearer, more interesting, and easier to interpret. Graphs are essential in assisting chemical engineers as a frequent possible. Provide the screen shoot for all steps followed. 1. Use the GC Lab data create a Scatter Chart 2. Add Chart Title, Vertical and Horizontal Titles GOXGC Proxy Dataxdsx (20) Total = 50 Marks] UNISA@ 2022 Sebokeng Sharpeville Zamdela + F T 5 6 7 8 9 10 11 12 13 14. 15 16 17 18 19 20 21 22 23 24 25 26 27 28 29 30 31 32 33 34 35 36 37 38 39 40 41 42 43 44 45 46 47 48 49 50 51 B B C D E 6/1/2007 0:00 11.4913129 15.4537456 26.887633249.6140687 7/1/2007 0:00 13.1500657 15.560247 30.3227051 125.337838 8/1/2007 0:00 7.55733039 14.0373043 23.3286463122.592366 9/1/2007 0:00 7.74050827 11.436277 15,2348455 112.342709 10/1/2007 0:00 5.630141934.02033141 11.8843003 43.4742062 11/1/2007 0:00 2.14430543 7.14345432 9.91736349 34.2667824 12/1/2007 0:00 2.57494055 8.3834065 4.44687648 47.8012468 1/1/2008 0:00 4.01686264 8.73216092 12.2533473 40.1549994 2/1/2008 0:00 6.13335067 9.08755476 11.8577017 49.3212802 3/1/2008 0:00 5.55751641 8.13241675 10.70748 44.440812 4/1/2008 0:00 14.5455147 12.8296809 20.7870104 83.161854 5/1/2008 0:00 11.9034141 18.3864394 28.671652384.7233381 6/1/2008 0:00 11.6911985 15.8907728 22.8304928 48.5444538 7/1/2008 0:00 7.80602535 17.1437858 25.5333585 125.067239 8/1/2008 0:00 5.48724813 15.4213262 20.5387686 127.201359 9/1/2008 0:00 7.16568561 12.3632826 16.845607 48.2122183 10/1/2008 0:00 3.72517216 11.8676605 14,248205264.0283713 11/1/2008 0:00 3.2746427 10.765381113.4536866 12/1/2008 0:00 2.86203846 8.7734361911.1411714 1/1/2009 0:00 3.04174705 8.85745442 11.0687219 2/1/2009 0:00 4.78011068 10.3248845 15.1544204 3/1/2009 0:00 5.70434922 11.200242115.840829365.4619064 4/1/2009 0:00 2.05038043 1.4865406 3.94640429 113.744412 5/1/2009 0:00 89.8411718 6/1/2009 0:00 108.028348 7/1/2004 0:00 0 0 0 0 156.230577 8/1/2009 0:00 113.956674 9/1/2004 0:00 149.607348 10/1/2009 0:00 0 0 0 83.153479 11/1/2009 0:00 6.845124735.7310677664.8547457 12/1/2009 0:00 5.00264478 12.0316478 14.794521 56.3282948 1/1/2010 0:00 3.81204511 12.0831871 13.4547751 2/1/2010 0:00 4.78726449 12.8156145 17.5804773 3/1/2010 0:00 4.05876658 11.6044958 14.9411141 4/1/2010 0:00 5/1/2010 0:00 6/1/2010 0:00 7/1/2010 0:00 8/1/2010 0:00 9/1/2010 0:00 10/1/2010 0:00 11/1/2010 0:00 12/1/2010 0:00 9.51054 12.3329075 16.6487262 1/1/2011 0:00 8.17717753 11.0850587 15.7637677 2/1/2011 0:00 3/1/2011 0:00 4/1/2011 0:00 7.56752061 12.6242436 17.1128213 0 F/4/2014 0.nolo EEQ-427761771 177220207LLLLCLA 648 672 646 720 744 768 38.72 35.91 37.74 37.37 35.75 36.36 36.17 36.94 33.41 31.62 32.98 792 8.41 8.20 7.73 7.73 8.48 8.72 8.42 8.23 8.62 8.44 8.41 8.17 8.66 32.04 33,29 32.62 8.28 28 GCXGC27 29 GCXGC 28 30 GCXGC 29 31 GAGC 30 32 (Cac 31 33 Cac 32 34 GCXGC 33 35 CXGC 34 36 Camc 35 37 Camc 36 38 qCxc 37 3 GCAC 38 40 Camc 3 41 Camc 40 42 GCXGC 41 43 GCXGC 42 44 GCXGC 43 45 GCXGC 44 46 Camc 45 47 GCG46 48 Gxqc47 49 GCXGC 48 50 GZxqc 4 51 GCNG 50 52 Cx51 53 CXGC 52 54 qCxg53 55 GCXGC 54 56 Gx ( 55 57 GAG 56 58 Cx57 5 GCNG 58 60 CGC 5 61 Gx 60 62 GCXGC 61 63 GCXGC 62 64 Gx (63 65 GCXGC 64 66 GCXGC 65 67 GCXGC 66 68 GCxC67 6 GCXGC 68 70 x 6% 71 70x70 70 72 GCXGC 71 73 GCXGC 72 74 GCXGC 73 75 GCXGC 74 72 LVL 75 816 840 864 888 912 436 960 484 1008 1032 1056 1080 1104 1128 1152 1176 1200 1224 1248 1272 1296 1320 1344 1368 1342 1416 1440 1464 1488 1512 1536 1560 1584 1608 1632 1656 1680 1704 1728 1752 1776 1800 31.64 32.45 31.77 32.09 32,25 31.75 33.84 32.95 34.50 33.35 32.93 34.16 32.49 33.41 33.45 34.47 33.76 37.88 37.32 38.29 35.52 38.98 37.25 36.97 7.47 8.38 8.23 9.02 8.43 10.25 4.37 8.92 8.94 8.61 8.46 8.71 8.92 8.78 8.76 8.66 8.71 4.59 8.90 8.58 8.47 4.62 8.70 10.25 4.34 10.60 11.27 8.99 35.92 37.03 34.93 34.77 37.52 37.77 36.46 35.86 36.26 36.31 25.98 8.75 8.76 8.42 8.147 7.6% 7.47 734 TIL OStep by Step Solution
There are 3 Steps involved in it
Step: 1

Get Instant Access to Expert-Tailored Solutions
See step-by-step solutions with expert insights and AI powered tools for academic success
Step: 2

Step: 3

Ace Your Homework with AI
Get the answers you need in no time with our AI-driven, step-by-step assistance
Get Started


