Answered step by step
Verified Expert Solution
Question
1 Approved Answer
Please help with Matlab script, thank you! What other information would i need? This was all the information that was given for the assignment, sorry
Please help with Matlab script, thank you! 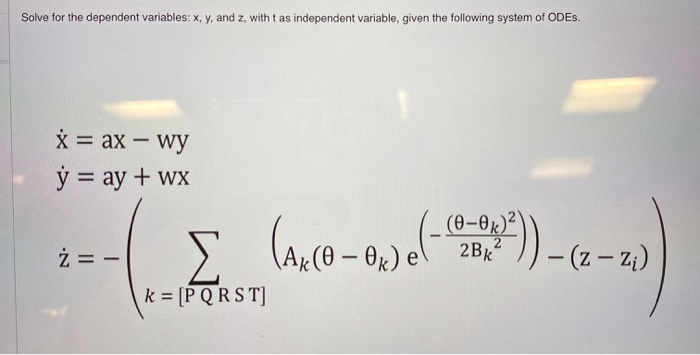

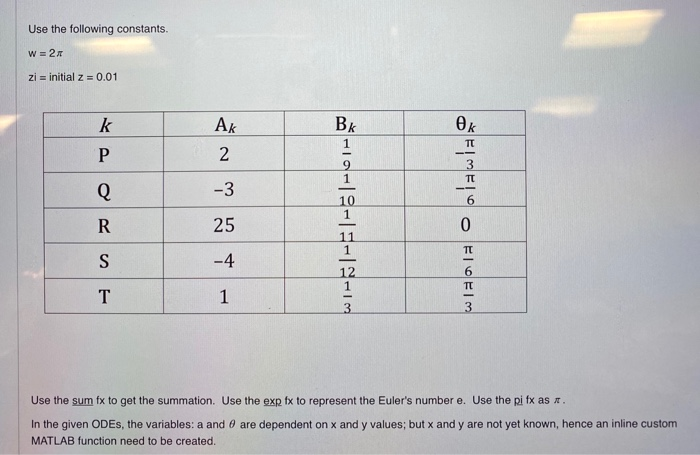
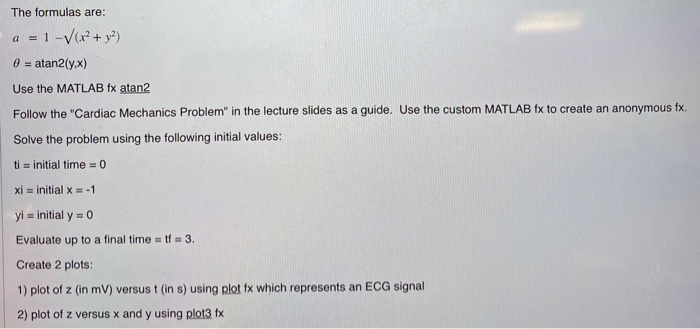
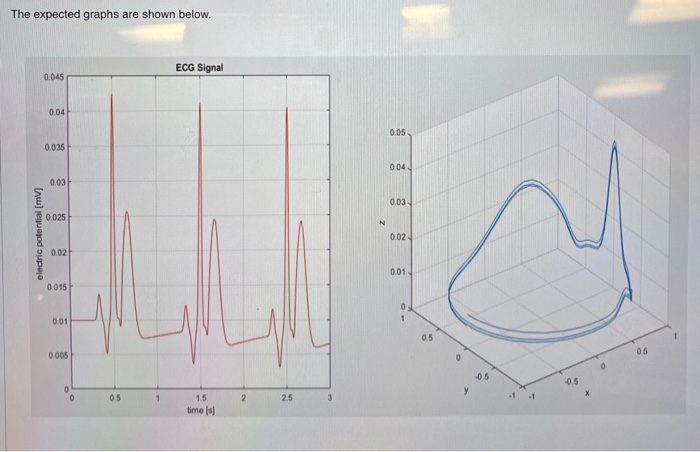
What other information would i need? 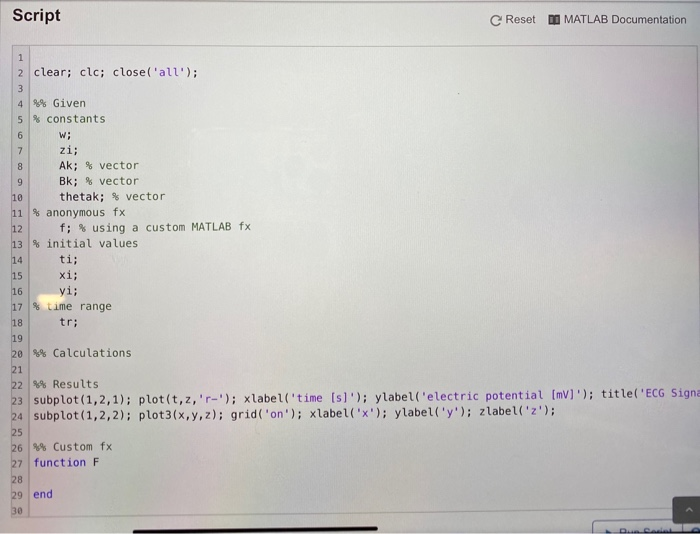

This was all the information that was given for the assignment, sorry for the inconvience but anything would help becuase i am completelty lost. Thank you for your time!
Solve for the dependent variables: x, y, and z, with t as independent variable, given the following system of ODES. * = ax wy y = ay + wx --- E (960-wel-5382).() 2 Bk =- k = [PQRST) Use the following constants. W = 2 zi = initial z= 0.01 WEINOWE Use the sum fx to get the summation. Use the exp fx to represent the Euler's number e. Use the pi fx as . In the given ODEs, the variables: a and 8 are dependent on x and y values; but x and y are not yet known, hence an inline custom MATLAB function need to be created. The formulas are: a = 1 -V(x + y) 0 = atan2(y,x) Use the MATLAB fx atan2 Follow the "Cardiac Mechanics Problem" in the lecture slides as a guide. Use the custom MATLAB fx to create an anonymous fx. Solve the problem using the following initial values: ti = initial time = 0 Xi = initial x = -1 yi = initial y = 0 Evaluate up to a final time = tf = 3. Create 2 plots: 1) plot of z (in mV) versus t (in s) using plot 1x which represents an ECG signal 2) plot of z versus x and y using plot3 fx The expected graphs are shown below. ECG Signal 0.045 0.04 0.05 0.035 0.04 0.03 0.03 electric potential [mV] 0.02 0.01 0.01 0.005 2 15 time (s) Script C Reset D MATLAB Documentation 2 clear; clc; closel'all'); % Given % constants zi; Ak; % vector Bk; % vector thetak; % vector anonymous fx f; % using a custom MATLAB fx % initial values ti; xi; vi; time range tr; %% Calculations 22 %% Results 23 subplot(1,2,1); plot(t,,'r-'); xlabel('time [s]'); ylabel('electric potential [mV]'); title('ECG Sign subplot(1,2,2); plot3(x, y, z); grid('on'); xlabel('x'); ylabel('y'); zlabel('2'); % Custom fx 27 function F 29 end Solve for the dependent variables: x, y, and z, with t as independent variable, given the following system of ODES. * = ax wy y = ay + wx --- E (960-wel-5382).() 2 Bk =- k = [PQRST) Use the following constants. W = 2 zi = initial z= 0.01 WEINOWE Use the sum fx to get the summation. Use the exp fx to represent the Euler's number e. Use the pi fx as . In the given ODEs, the variables: a and 8 are dependent on x and y values; but x and y are not yet known, hence an inline custom MATLAB function need to be created. The formulas are: a = 1 -V(x + y) 0 = atan2(y,x) Use the MATLAB fx atan2 Follow the "Cardiac Mechanics Problem" in the lecture slides as a guide. Use the custom MATLAB fx to create an anonymous fx. Solve the problem using the following initial values: ti = initial time = 0 Xi = initial x = -1 yi = initial y = 0 Evaluate up to a final time = tf = 3. Create 2 plots: 1) plot of z (in mV) versus t (in s) using plot 1x which represents an ECG signal 2) plot of z versus x and y using plot3 fx The expected graphs are shown below. ECG Signal 0.045 0.04 0.05 0.035 0.04 0.03 0.03 electric potential [mV] 0.02 0.01 0.01 0.005 2 15 time (s) Script C Reset D MATLAB Documentation 2 clear; clc; closel'all'); % Given % constants zi; Ak; % vector Bk; % vector thetak; % vector anonymous fx f; % using a custom MATLAB fx % initial values ti; xi; vi; time range tr; %% Calculations 22 %% Results 23 subplot(1,2,1); plot(t,,'r-'); xlabel('time [s]'); ylabel('electric potential [mV]'); title('ECG Sign subplot(1,2,2); plot3(x, y, z); grid('on'); xlabel('x'); ylabel('y'); zlabel('2'); % Custom fx 27 function F 29 end Step by Step Solution
There are 3 Steps involved in it
Step: 1

Get Instant Access to Expert-Tailored Solutions
See step-by-step solutions with expert insights and AI powered tools for academic success
Step: 2

Step: 3

Ace Your Homework with AI
Get the answers you need in no time with our AI-driven, step-by-step assistance
Get Started


