Answered step by step
Verified Expert Solution
Question
1 Approved Answer
Please, I need the solution step by step in Excel, answering and explaining the results in logical manner. It is the third time I upload
Please, I need the solution step by step in Excel, answering and explaining the results in logical manner. It is the third time I upload this, please don't copy paste the anterior answers provided because they are incomplete.
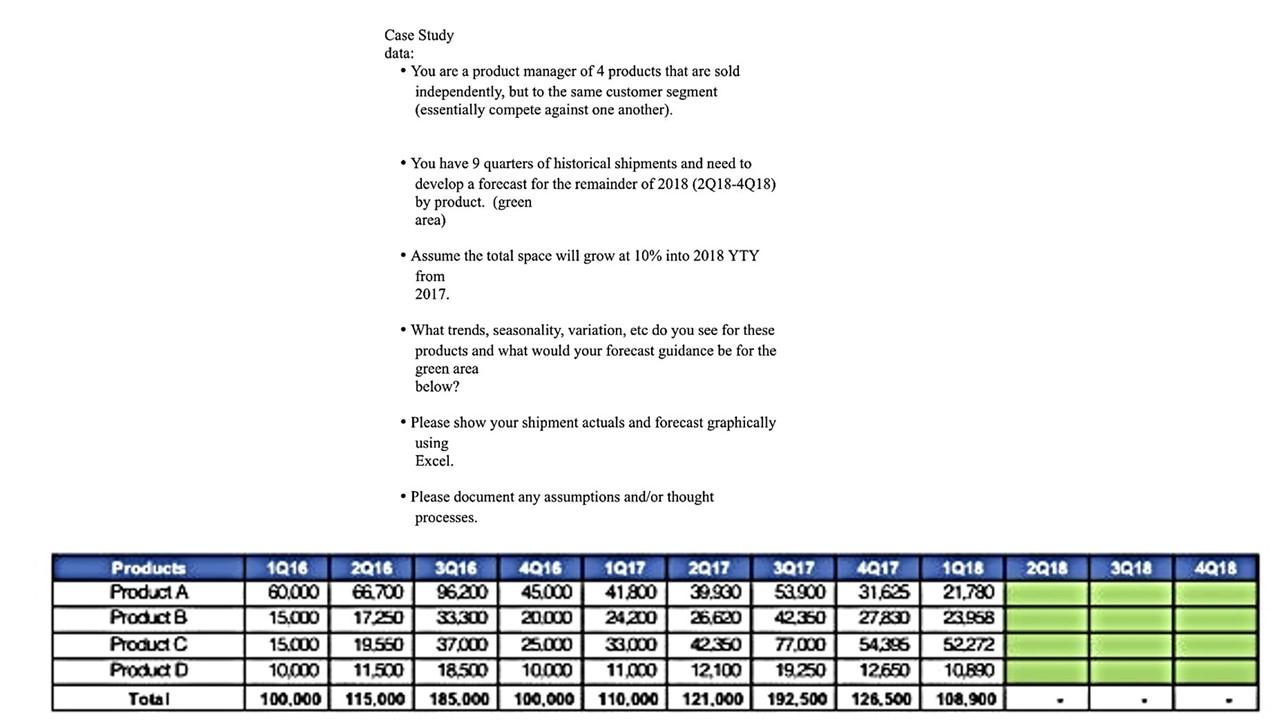
Case Study data: You are a product manager of 4 products that are sold independently, but to the same customer segment (essentially compete against one another). You have 9 quarters of historical shipments and need to develop a forecast for the remainder of 2018 (2Q18-4Q18) by product. (green area) Assume the total space will grow at 10% into 2018 YTY from 2017. What trends, seasonality, variation, etc do you see for these products and what would your forecast guidance be for the green area below? . Please show your shipment actuals and forecast graphically using Excel. . Please document any assumptions and/or thought processes. 2018 3Q18 4018 Products Product A Product B Product C Procido 1Q16 60.000 15.000 15.000 10,000 100,000 2016 66700 17250 19.550 11.500 115,000 3016 96200 300 37.000 18500 4016 45.000 20.000 25.000 10.000 100.000 1917 41.800 24200 33.000 11.000 110.000 2017 39.900 26.620 2350 12,100 121,000 3017 53.900 42350 77.000 19250 192,500 4017 31.625 27& 54396 12650 126.500 1018 21,780 22968 52272 10890 Total 185.000 108,900Step by Step Solution
There are 3 Steps involved in it
Step: 1
Get Instant Access to Expert-Tailored Solutions
See step-by-step solutions with expert insights and AI powered tools for academic success
Step: 2
Step: 3
Ace Your Homework with AI
Get the answers you need in no time with our AI-driven, step-by-step assistance
Get Started