

Answered step by step
Verified Expert Solution
Question
1 Approved Answer
Please I only need the answers for question E7.12 new pics EXERCISES Remember when forecasting that one set of right answers does not exist. Rather,
Please I only need the answers for question E7.12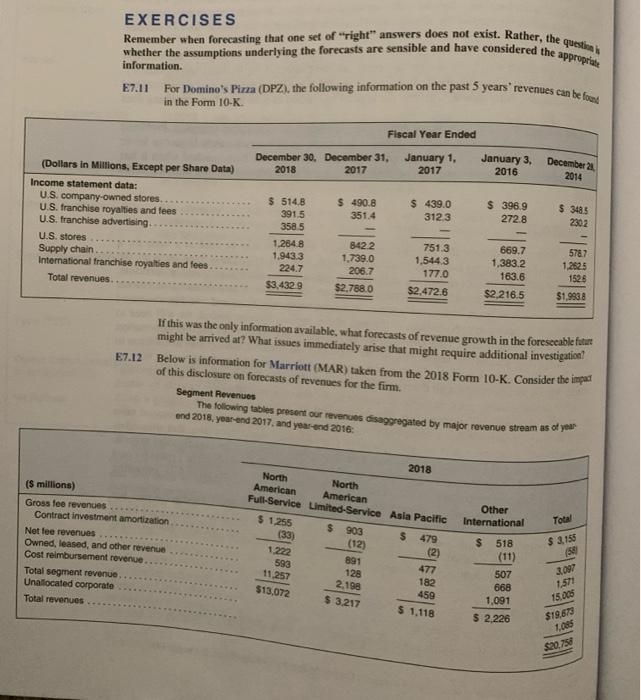
new pics 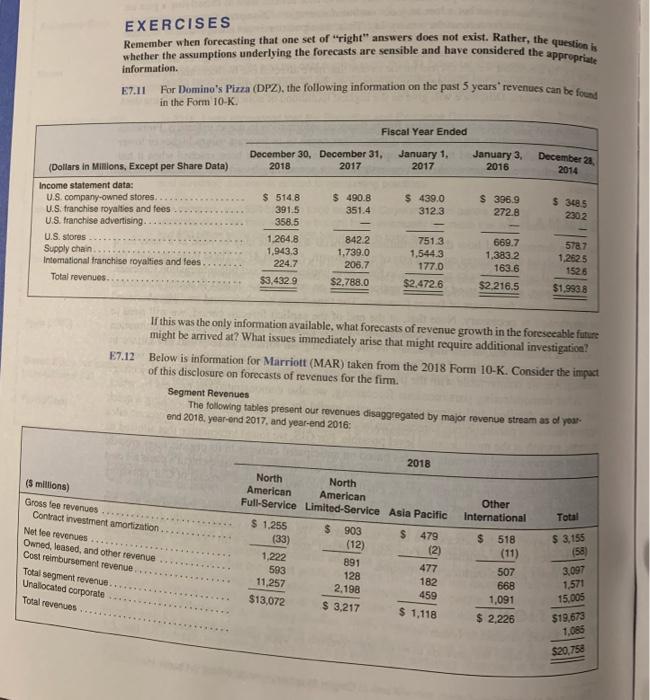
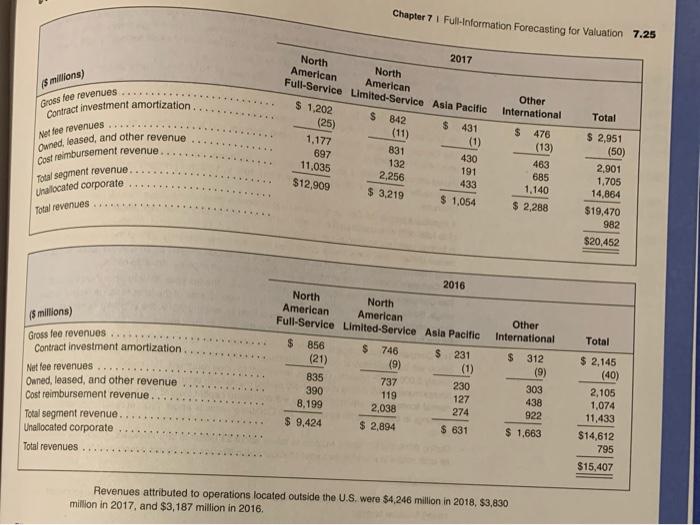
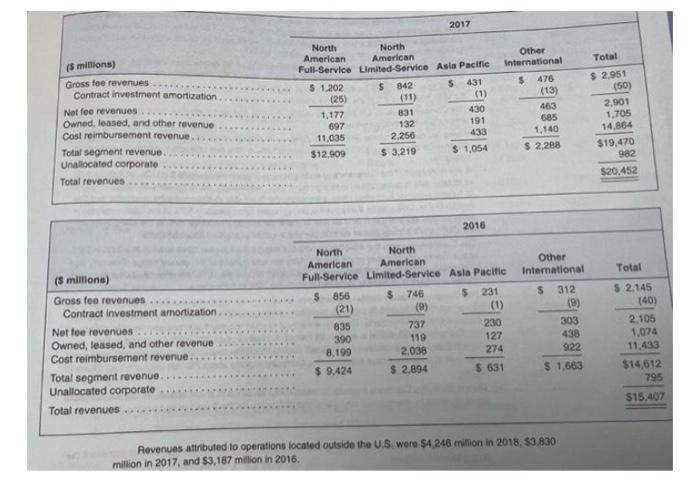
EXERCISES Remember when forecasting that one set of "right" answers does not exist. Rather, the question is whether the assumptions underlying the forecasts are sensible and have considered the appropriate information. For Domino's Pizza (DPZ), the following information on the past 5 years' revenues can be found E7.11 in the Form 10-K. Fiscal Year Ended December 21 December 30, December 31, 2018 2017 January 1, 2017 January 3, 2016 2014 (Dollars in Millions, Except per Share Data) Income statement data: U.S. company-owned stores.. $ 514.8 391.5 358.5 $ 490.8 351.4 $ 439.0 312.3 $ 396.9 272.8 U.S. franchise royalties and fees U.S. franchise advertising. $ 348.5 2302 1,264.8 842.2 751.3 669.7 578.7 U.S. stores Supply chain. 1,943.3 1,739.0 1,544.3 1,383.2 1,262.5 International franchise royalties and fees. 224.7 206.7 177.0 163.6 1526 Total revenues.. $3,432.9 $2,788.0 $2,472.6 $2,216.5 $1,993.8 If this was the only information available, what forecasts of revenue growth in the foreseeable future might be arrived at? What issues immediately arise that might require additional investigation? Below is information for Marriott (MAR) taken from the 2018 Form 10-K. Consider the impact of this disclosure on forecasts of revenues for the firm. E7.12 Segment Revenues The following tables present our revenues disaggregated by major revenue stream as of year end 2018, year-end 2017, and year-end 2016: 2018 North American North American Full-Service Limited-Service Asia Pacific Other International Total $ 1,255 $ 903 $ 479 $ 518 (12) $ 3,155 (58) (11) 891 3.097 128 2,198 $ 3,217 ($ millions) Gross fee revenues Contract investment amortization. Net fee revenues Owned, leased, and other revenue Cost reimbursement revenue. Total segment revenue.. Unallocated corporate Total revenues. (33) 1,222 593 11,257 $13,072 (2) 477 182 459 $ 1,118 507 668 1,091 $ 2,226 1,571 15,005 $19,673 1,085 $20,758 (5 millions) Gross fee revenues.... Contract investment amortization Net fee revenues Owned, leased, and other revenue Cost reimbursement revenue. Total segment revenue. Unallocated corporate. Total revenues ($ millions) Gross fee revenues Contract investment amortization Net fee revenues Owned, leased, and other revenue Cost reimbursement revenue. Total segment revenue... Unallocated corporate Total revenues ***** www. ***** 2017 North North American American Full-Service Limited-Service Asia Pacific $ 1,202 $ 842 S 431 (25) (11) 831 430 1,177 697 11,035 132 191 2,256 433 $12.909 $ 3,219 $ 1,054 2016 North North American American Full-Service Limited-Service Asia Pacific $ 856 746 $ 231 (21) (9) (1) 737 (1) 835 230 390 119 127 438 8.199 2.038 274 922 $ 9,424 $ 2,894 $ 631 $1,663 Revenues attributed to operations located outside the U.S. were $4,246 million in 2018, $3.830 million in 2017, and $3,187 million in 2016. Other International $ 476 (13) 463 685 1,140 $ 2,288 Other International $ 312 (9) 303 Total $ 2,951 2,901 1,705 14,864 $19,470 982 $20,452 Total $ 2,145 (50) (40) 2,105 1,074 11,433 $14,612 795 $15.407 EXERCISES Remember when forecasting that one set of "right" answers does not exist. Rather, the question is whether the assumptions underlying the forecasts are sensible and have considered the appropriate information. E7.11 For Domino's Pizza (DP2), the following information on the past 5 years' revenues can be found in the Form 10-K. Fiscal Year Ended December 28, December 30, December 31, 2018 2017 January 1, 2017 January 3, 2016 2014 (Dollars in Millions, Except per Share Data) Income statement data: $ 514.8 $ 490.8 U.S. company-owned stores. $ 439.0 312.3 $ 396.9 272.8 $ 348.5 230.2 391.5 351.4 U.S. franchise royalties and fees U.S. franchise advertising... 358.5 1,264.8 U.S. stores 842.2 751.3 669,7 578.7 Supply chain. 1,943.3 1,739.0 1,544.3 1,383.2 1,262.5 International franchise royalties and fees. 224.7 206.7 177.0 163.6 152.6 Total revenues. $3,432.9 $2,788.0 $2.472.6 $2,216.5 $1,993.8 If this was the only information available, what forecasts of revenue growth in the foreseeable future might be arrived at? What issues immediately arise that might require additional investigation? E7.12 Below is information for Marriott (MAR) taken from the 2018 Form 10-K. Consider the impact of this disclosure on forecasts of revenues for the firm. Segment Revenues The following tables present our revenues disaggregated by major revenue stream as of year- end 2018, year-end 2017, and year-end 2016: 2018 North North American American Full-Service Limited-Service Asia Pacific Other International Total $ 1,255 $ 903 $ 479 $ 518 (33) $ 3,155 (11) (58) 1,222 593 507 11,257 668 1,091 $13,072 $ 2,226 ($ millions) Gross fee revenues Contract investment amortization Net lee revenues. Owned, leased, and other revenue Cost reimbursement revenue. Total segment revenue. Unallocated corporate Total revenues.. (12) 891 128 2,198 $ 3,217 (2) 477 182 459 $1,118 3,097 1,571 15,005 $19,673 1,085 $20,758 (5 millions) Gross fee revenues Contract investment amortization. Net fee revenues Owned, leased, and other revenue Cost reimbursement revenue Total segment revenue.. Unallocated corporate Total revenues Chapter 7 1 Full-Information Forecasting for Valuation 7.25 2017 North American North American Full-Service Limited-Service Asia Pacific Other International Total $ 1,202 $ 842 $ 431 $ 476 $ 2,951 (50) 2,901 1,705 14,864 $19,470 982 $20,452 Total $ 2,145 (40) 2,105 1,074 11,433 $14,612 795 $15,407 (25) 1,177 831 430 697 132 11,035 191 2,256 433 $12,909 $3,219 $1,054 2016 North American North American Full-Service Limited-Service Asia Pacific $ 856 $ 746 $ 231 (21) (9) 835 737 230 303 390 119 127 438 8,199 2,038 274 922 $ 9,424 $2,894 $ 631 $ 1.663 Revenues attributed to operations located outside the U.S. were $4,246 million in 2018, $3,830 million in 2017, and $3,187 million in 2016. (5 millions) Gross fee revenues Contract investment amortization Net fee revenues Owned, leased, and other revenue Cost reimbursement revenue. Total segment revenue... Unallocated corporate Total revenues. (11) (1) (1) (13) 463 685 1,140 $ 2,288 Other International $ 312 (9) Step by Step Solution
There are 3 Steps involved in it
Step: 1

Get Instant Access to Expert-Tailored Solutions
See step-by-step solutions with expert insights and AI powered tools for academic success
Step: 2

Step: 3
Ace Your Homework with AI
Get the answers you need in no time with our AI-driven, step-by-step assistance
Get Started
Management Accounting
Authors: Late RC Sekhar, AV Rajagopalan
1st Edition
195683609, 978-0195683608