Please include calculations.
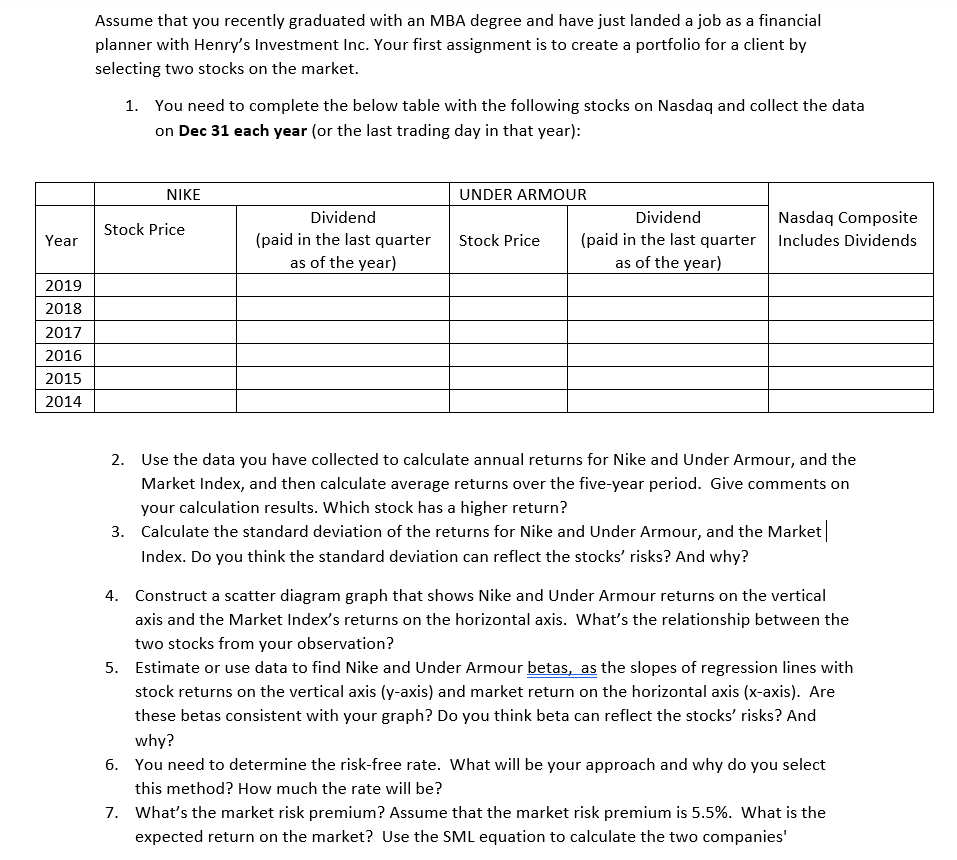
Assume that you recently graduated with an MBA degree and have just landed a job as a nancial planner with Henry's Investment Inc. Your first assignment is to create a portfolio for a client by selecting two stocks on the market. 1. You need to complete the below table with the following stocks on Nasdaq and collect the data on Dec 31 each year {or the last trading day in that year): NIKE UN[HHIARhU JR Year Dividend {paid in the last quarter as of the year} Stock Price Stock Price Dividend [paid in the last quarter as of the year) Nasdaq Composite Includes Dividends 2019 2018 201? 2016 2015 2014 2. Use the data you have collected to calculate annual returns for Nike and Under Armour, and the Market Index, and then calculate average returns over the fiveyear period. Give comments on your calculation results. Which stock has a higher return? 3. Calculate the standard deviation of the returns for Nike and Under Armour, and the Market Index. Do you think the standard deviation can reflect the stocks' risks? And why? 4. Construct a scatter diagram graph that shows Nike and Under Armour returns on the vertical axis and the Market Indefs returns on the horizontal axis. What's the relationship between the two stocks from your observation? 5. Estimate or use data to find Nike and Under Armour betas, as the slopes of regression lines with stock returns on the vertical axis [yaxis} and market return on the horizontal axis {xaxis]. Are these betas consistent with your graph? Do you think beta can reflect the stocks' risks? And why? 6. You need to determine the riskfree rate. What will be your approach and why do you select this method? How much the rate will be? 7. What's the market risk premium? Assume that the market risk premium is 5.5%. What is the expected return on the market? Use the SML equation to calculate the two companies'