Please include last question also. Buy, Hold, Sell?
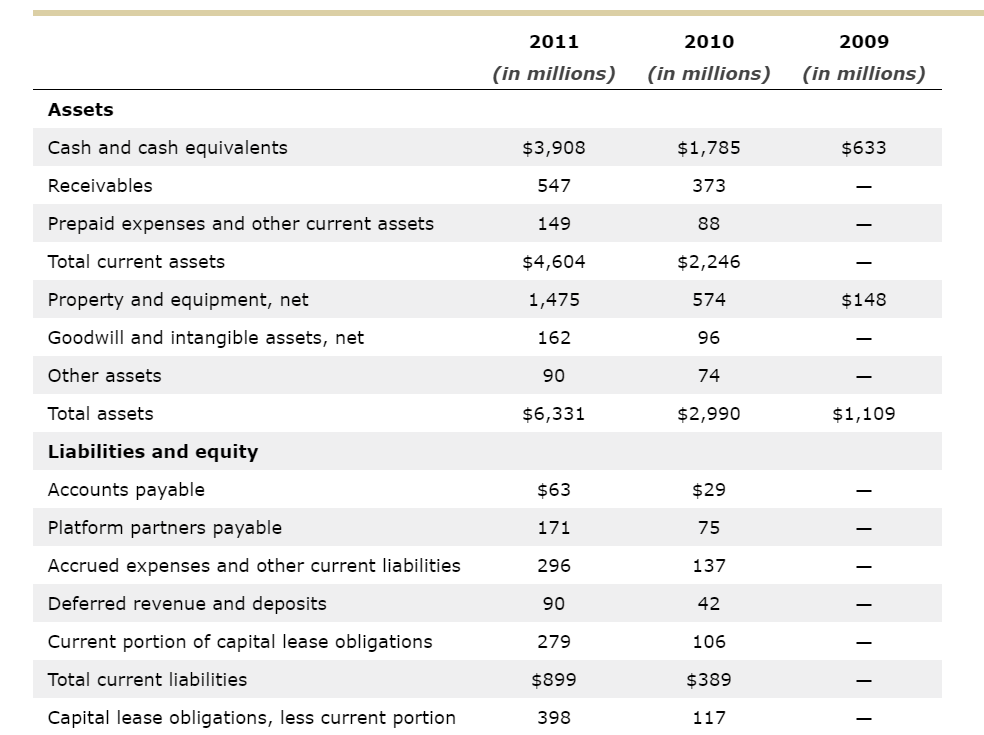
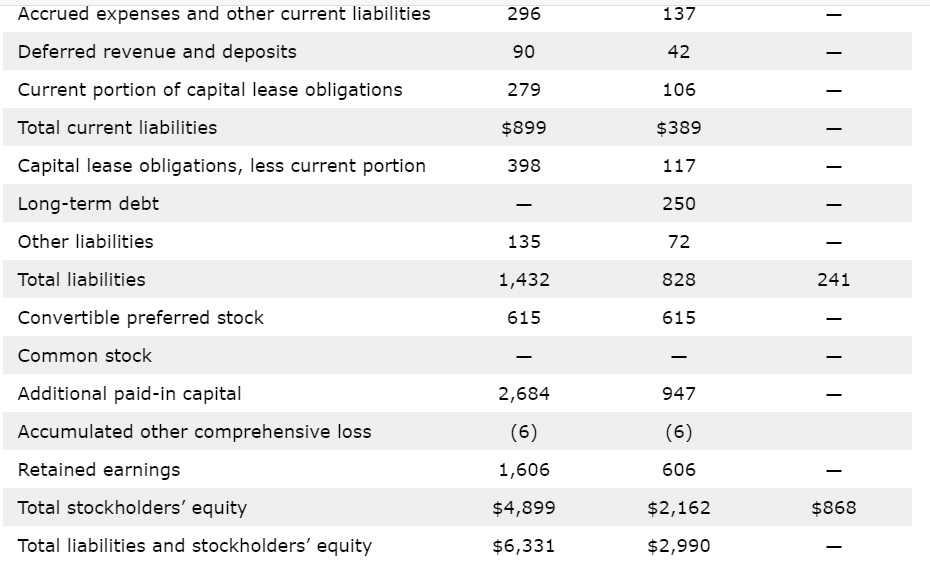
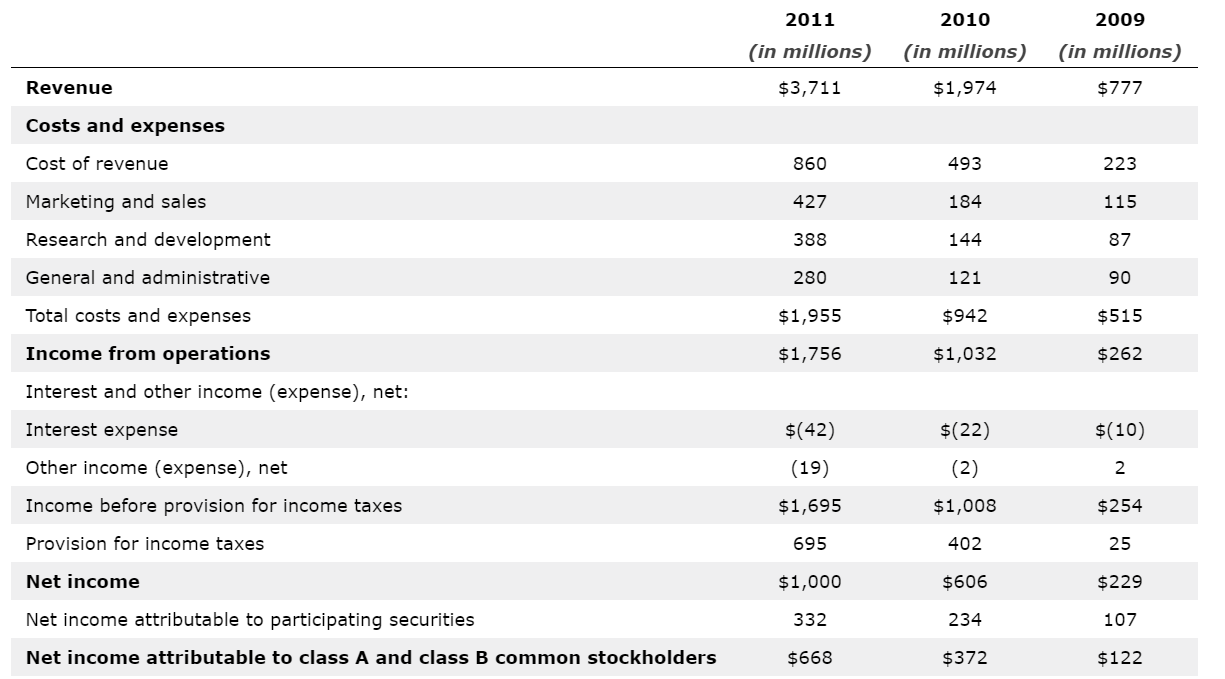
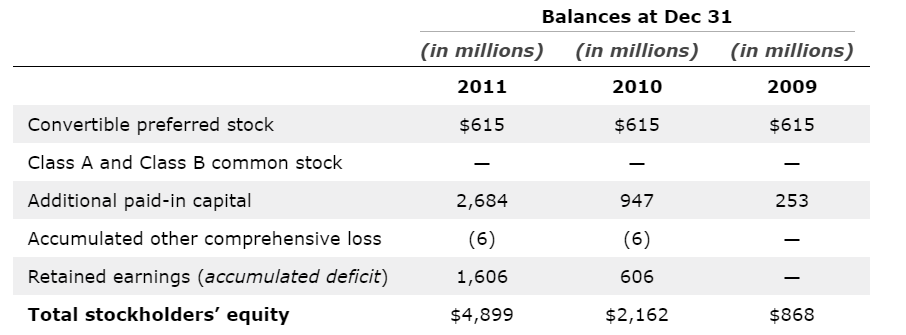
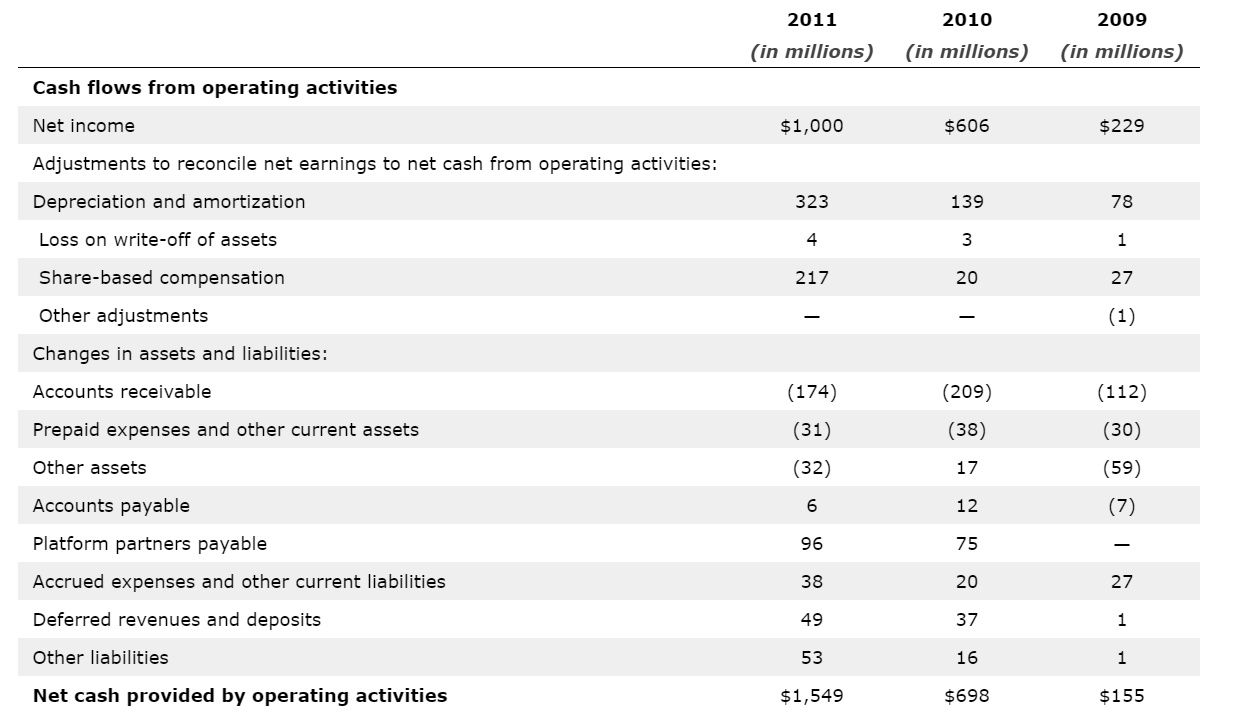
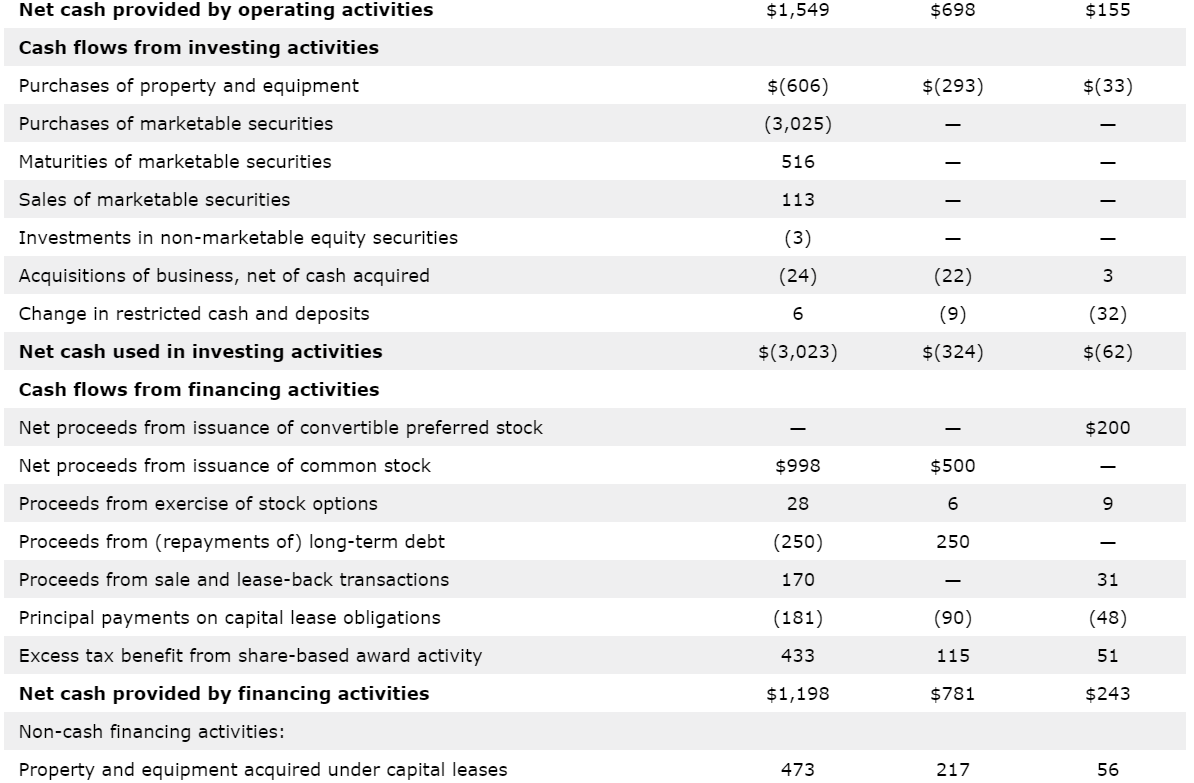

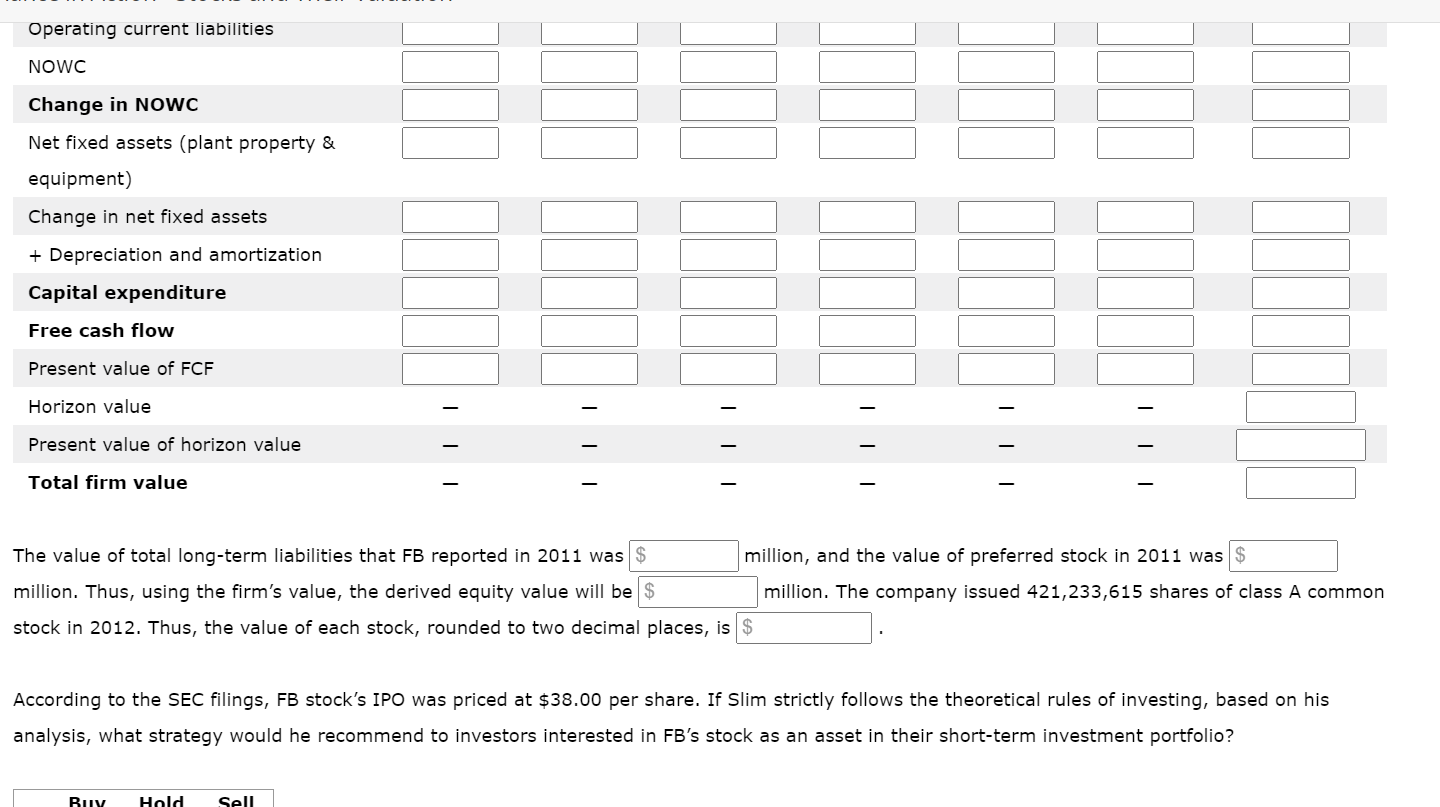
2011 2010 2009 (in millions) (in millions) (in millions) Assets Cash and cash equivalents $3,908 $1,785 $633 Receivables 547 373 Prepaid expenses and other current assets 149 88 Total current assets $4,604 $2,246 - Property and equipment, net 1,475 574 $148 Goodwill and intangible assets, net 162 96 Other assets 90 74 Total assets $6,331 $2,990 $1,109 Liabilities and equity Accounts payable $63 $29 Platform partners payable 171 75 Accrued expenses and other current liabilities 296 137 Deferred revenue and deposits 90 42 | | | | | | Current portion of capital lease obligations 279 106 Total current liabilities $899 $389 Capital lease obligations, less current portion 398 117 296 137 90 42 Accrued expenses and other current liabilities Deferred revenue and deposits Current portion of capital lease obligations Total current liabilities Capital lease obligations, less current portion 279 106 $899 $389 398 117 Long-term debt 250 135 72 Other liabilities Total liabilities 1,432 828 241 615 615 Convertible preferred stock Common stock 2,684 947 (6) (6) Additional paid-in capital Accumulated other comprehensive loss Retained earnings Total stockholders' equity Total liabilities and stockholders' equity 1,606 606 $4,899 $2,162 $868 $6,331 $2,990 2011 2010 2009 (in millions) (in millions) $1,974 (in millions) $777 Revenue $3,711 Costs and expenses Cost of revenue 860 493 223 Marketing and sales 427 184 115 Research and development 388 144 87 General and administrative 280 121 90 Total costs and expenses $1,955 $942 $515 Income from operations $1,756 $1,032 $262 Interest and other income (expense), net: Interest expense $(42) $(10) $(22) (2) Other income (expense), net (19) 2 Income before provision for income taxes $1,695 $1,008 $254 Provision for income taxes 695 402 25 Net income $1,000 $606 $229 Net income attributable to participating securities 332 234 107 Net income attributable to class A and class B common stockholders $668 $372 $122 Balances at Dec 31 (in millions) (in millions) (in millions) 2011 2010 2009 $615 $615 $615 2,684 947 253 Convertible preferred stock Class A and Class B common stock Additional paid-in capital Accumulated other comprehensive loss Retained earnings (accumulated deficit) Total stockholders' equity (6) (6) 1,606 606 $4,899 $2,162 $868 2011 2010 2009 (in millions) (in millions) (in millions) Cash flows from operating activities Net income $1,000 $606 $229 Adjustments to reconcile net earnings to net cash from operating activities: Depreciation and amortization 323 139 78 Loss on write-off of assets 4 3 1 217 20 27 Share-based compensation Other adjustments (1) Changes in assets and liabilities: Accounts receivable (174) (112) (209) (38) Prepaid expenses and other current assets (31) (32) Other assets 17 (30) (59) (7) Accounts payable 6 12 96 75 Platform partners payable Accrued expenses and other current liabilities Deferred revenues and deposits 38 20 27 49 37 1 Other liabilities 53 16 1 Net cash provided by operating activities $1,549 $698 $155 $1,549 $698 $155 Net cash provided by operating activities Cash flows from investing activities Purchases of property and equipment $(606) $(293) $(33) Purchases of marketable securities (3,025) Maturities of marketable securities 516 Sales of marketable securities 113 Investments in non-marketable equity securities (3) (24) (22) 3 6 (9) (32) Acquisitions of business, net of cash acquired Change in restricted cash and deposits Net cash used in investing activities Cash flows from financing activities $(3,023) $(324) $(62) Net proceeds from issuance of convertible preferred stock - $200 Net proceeds from issuance of common stock $998 $500 28 6 9 Proceeds from exercise of stock options Proceeds from (repayments of) long-term debt (250) 250 Proceeds from sale and lease-back transactions 170 31 (181) (90) (48) 433 115 51 Principal payments on capital lease obligations Excess tax benefit from share-based award activity Net cash provided by financing activities Non-cash financing activities: $1,198 $781 $243 Property and equipment acquired under capital leases 473 217 56 After discussing the different aspects of the valuation, Slim puts together his FCF projections. Complete the missing elements from his projection: Note: When entering intermediate calculations, round to the nearest whole number, but do not round the intermediate calculations when determining final answers. For example: If the revenue growth rate is 11%, and the answers for revenue for 2012-2014 are 1103, 1224.33, and 1359.0063, then you should enter 1103, 1224, and 1359 as answers, but use 1359.0063 to calculate the revenue for 2015. If your answer is negative, use a minus (-) sign. 2012 2013 2014 2015 2016 2017 2018 (in millions) (in millions) (in millions) (in millions) (in millions) (in millions) (in millions) Revenue growth rate 18% 18% 18% 18% 18% 5% 5% Revenues $ $ $ $ $ $ $ - Total costs and expenses Income from operations (EBIT) - Taxes Net operating profit after taxes (NOPAT) Operating current assets 1 Operating current liabilities Operating current liabilities NOWC Change in NOWC Net fixed assets (plant property & equipment) Change in net fixed assets + Depreciation and amortization Capital expenditure Free cash flow Present value of FCF Horizon value Present value of horizon value Total firm value The value of total long-term liabilities that FB reported in 2011 was $ million, and the value of preferred stock in 2011 was $ million. Thus, using the firm's value, the derived equity value will be $ million. The company issued 421,233,615 shares of class A common stock in 2012. Thus, the value of each stock, rounded to two decimal places, is $ According to the SEC filings, FB stock's IPO was priced at $38.00 per share. If Slim strictly follows the theoretical rules of investing, based on his analysis, what strategy would he recommend to investors interested in FB's stock as an asset in their short-term investment portfolio? Ruy Hold Sell 2011 2010 2009 (in millions) (in millions) (in millions) Assets Cash and cash equivalents $3,908 $1,785 $633 Receivables 547 373 Prepaid expenses and other current assets 149 88 Total current assets $4,604 $2,246 - Property and equipment, net 1,475 574 $148 Goodwill and intangible assets, net 162 96 Other assets 90 74 Total assets $6,331 $2,990 $1,109 Liabilities and equity Accounts payable $63 $29 Platform partners payable 171 75 Accrued expenses and other current liabilities 296 137 Deferred revenue and deposits 90 42 | | | | | | Current portion of capital lease obligations 279 106 Total current liabilities $899 $389 Capital lease obligations, less current portion 398 117 296 137 90 42 Accrued expenses and other current liabilities Deferred revenue and deposits Current portion of capital lease obligations Total current liabilities Capital lease obligations, less current portion 279 106 $899 $389 398 117 Long-term debt 250 135 72 Other liabilities Total liabilities 1,432 828 241 615 615 Convertible preferred stock Common stock 2,684 947 (6) (6) Additional paid-in capital Accumulated other comprehensive loss Retained earnings Total stockholders' equity Total liabilities and stockholders' equity 1,606 606 $4,899 $2,162 $868 $6,331 $2,990 2011 2010 2009 (in millions) (in millions) $1,974 (in millions) $777 Revenue $3,711 Costs and expenses Cost of revenue 860 493 223 Marketing and sales 427 184 115 Research and development 388 144 87 General and administrative 280 121 90 Total costs and expenses $1,955 $942 $515 Income from operations $1,756 $1,032 $262 Interest and other income (expense), net: Interest expense $(42) $(10) $(22) (2) Other income (expense), net (19) 2 Income before provision for income taxes $1,695 $1,008 $254 Provision for income taxes 695 402 25 Net income $1,000 $606 $229 Net income attributable to participating securities 332 234 107 Net income attributable to class A and class B common stockholders $668 $372 $122 Balances at Dec 31 (in millions) (in millions) (in millions) 2011 2010 2009 $615 $615 $615 2,684 947 253 Convertible preferred stock Class A and Class B common stock Additional paid-in capital Accumulated other comprehensive loss Retained earnings (accumulated deficit) Total stockholders' equity (6) (6) 1,606 606 $4,899 $2,162 $868 2011 2010 2009 (in millions) (in millions) (in millions) Cash flows from operating activities Net income $1,000 $606 $229 Adjustments to reconcile net earnings to net cash from operating activities: Depreciation and amortization 323 139 78 Loss on write-off of assets 4 3 1 217 20 27 Share-based compensation Other adjustments (1) Changes in assets and liabilities: Accounts receivable (174) (112) (209) (38) Prepaid expenses and other current assets (31) (32) Other assets 17 (30) (59) (7) Accounts payable 6 12 96 75 Platform partners payable Accrued expenses and other current liabilities Deferred revenues and deposits 38 20 27 49 37 1 Other liabilities 53 16 1 Net cash provided by operating activities $1,549 $698 $155 $1,549 $698 $155 Net cash provided by operating activities Cash flows from investing activities Purchases of property and equipment $(606) $(293) $(33) Purchases of marketable securities (3,025) Maturities of marketable securities 516 Sales of marketable securities 113 Investments in non-marketable equity securities (3) (24) (22) 3 6 (9) (32) Acquisitions of business, net of cash acquired Change in restricted cash and deposits Net cash used in investing activities Cash flows from financing activities $(3,023) $(324) $(62) Net proceeds from issuance of convertible preferred stock - $200 Net proceeds from issuance of common stock $998 $500 28 6 9 Proceeds from exercise of stock options Proceeds from (repayments of) long-term debt (250) 250 Proceeds from sale and lease-back transactions 170 31 (181) (90) (48) 433 115 51 Principal payments on capital lease obligations Excess tax benefit from share-based award activity Net cash provided by financing activities Non-cash financing activities: $1,198 $781 $243 Property and equipment acquired under capital leases 473 217 56 After discussing the different aspects of the valuation, Slim puts together his FCF projections. Complete the missing elements from his projection: Note: When entering intermediate calculations, round to the nearest whole number, but do not round the intermediate calculations when determining final answers. For example: If the revenue growth rate is 11%, and the answers for revenue for 2012-2014 are 1103, 1224.33, and 1359.0063, then you should enter 1103, 1224, and 1359 as answers, but use 1359.0063 to calculate the revenue for 2015. If your answer is negative, use a minus (-) sign. 2012 2013 2014 2015 2016 2017 2018 (in millions) (in millions) (in millions) (in millions) (in millions) (in millions) (in millions) Revenue growth rate 18% 18% 18% 18% 18% 5% 5% Revenues $ $ $ $ $ $ $ - Total costs and expenses Income from operations (EBIT) - Taxes Net operating profit after taxes (NOPAT) Operating current assets 1 Operating current liabilities Operating current liabilities NOWC Change in NOWC Net fixed assets (plant property & equipment) Change in net fixed assets + Depreciation and amortization Capital expenditure Free cash flow Present value of FCF Horizon value Present value of horizon value Total firm value The value of total long-term liabilities that FB reported in 2011 was $ million, and the value of preferred stock in 2011 was $ million. Thus, using the firm's value, the derived equity value will be $ million. The company issued 421,233,615 shares of class A common stock in 2012. Thus, the value of each stock, rounded to two decimal places, is $ According to the SEC filings, FB stock's IPO was priced at $38.00 per share. If Slim strictly follows the theoretical rules of investing, based on his analysis, what strategy would he recommend to investors interested in FB's stock as an asset in their short-term investment portfolio? Ruy Hold Sell