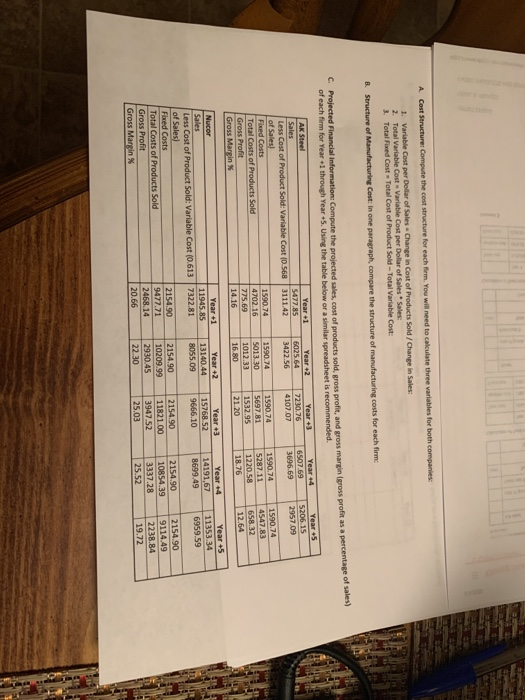
please look at section B. please compare the structure of the manufacturing costs of the two firms. in a paragraph.
the other sheet section D gross margin comparrison for the two firms years +1 through+5. see the second sheet.
A Cost Structures Compute the cost structure for each firm. You will need to calculate three variables for both companies 1. Variable Cost per Dollar of Sales - Change in Cost of Products Sold / Change in Sales: 2. Total Variable Cost Variable Cost per Dollar of Sales Sales 3. Total Fixed Cost Total Cost of Product Sold-Total Variable Cost: B. Structure of Manufacturing Cost: In one paragraph, compare the structure of manufacturing costs for each firme Frojected Financial Information: Compute the projected sales, cost of products sold, gross profit, and gross margin gross profit as a percentage of of each firm for Year 1 through Year *5. Using the table below or a similar spreadsheet is recommended. Year 1 Year +2 Year +3 Year 4 Year 5 Sales S477.85 6 025.64 22.10.76 6507.69 5206.15 Less Cost of Product Sold: Variable Cost 10.568 3111.42 3422.56 4107.07 3696.69 2957.09 of Sales Fixed Costs 1590.74 1590.74 1590.74 1590.74 1590.74 Total Costs of Products Sold 4702.16 5013 30 5697.81 5287.11 4547.83 Gross Profit 775.69 1012.33 1532.95 1220.58 Gross Margin 14.16 16.80 21.20 18.76 12.64 65832 Nucor Year -1 11945.85 7322.81 Year +2 13140.44 8055.09 Year 3 15768 52 9666.10 Year 14 14191,67 8699.49 Year 5 11353.34 6959.59 Sales Less Cost of Product Sold: Variable Cost (0.613 of Sales) Fixed Costs Total Costs of Products Sold Gross Profit Gross Margin % 2154.90 9477.71 2468.14 20.66 2154.90 10209.99 2930.45 22.30 2154.90 11821.00 3947.52 25.03 2154.90 10854.39 3337.28 1 25.52 2154.90 9114.49 2238.84 19.72 3 ping D. Gross Margin Comparison: In one to two paragraphs, explain why the levels and variability of the gross margin percentages differ for these two firms for Year through Year +5. Provide an example comparing the effect of the change in gross margin. (For example, if gross margin changed from 25% to 35%, what would it mean for each company?) A Cost Structures Compute the cost structure for each firm. You will need to calculate three variables for both companies 1. Variable Cost per Dollar of Sales - Change in Cost of Products Sold / Change in Sales: 2. Total Variable Cost Variable Cost per Dollar of Sales Sales 3. Total Fixed Cost Total Cost of Product Sold-Total Variable Cost: B. Structure of Manufacturing Cost: In one paragraph, compare the structure of manufacturing costs for each firme Frojected Financial Information: Compute the projected sales, cost of products sold, gross profit, and gross margin gross profit as a percentage of of each firm for Year 1 through Year *5. Using the table below or a similar spreadsheet is recommended. Year 1 Year +2 Year +3 Year 4 Year 5 Sales S477.85 6 025.64 22.10.76 6507.69 5206.15 Less Cost of Product Sold: Variable Cost 10.568 3111.42 3422.56 4107.07 3696.69 2957.09 of Sales Fixed Costs 1590.74 1590.74 1590.74 1590.74 1590.74 Total Costs of Products Sold 4702.16 5013 30 5697.81 5287.11 4547.83 Gross Profit 775.69 1012.33 1532.95 1220.58 Gross Margin 14.16 16.80 21.20 18.76 12.64 65832 Nucor Year -1 11945.85 7322.81 Year +2 13140.44 8055.09 Year 3 15768 52 9666.10 Year 14 14191,67 8699.49 Year 5 11353.34 6959.59 Sales Less Cost of Product Sold: Variable Cost (0.613 of Sales) Fixed Costs Total Costs of Products Sold Gross Profit Gross Margin % 2154.90 9477.71 2468.14 20.66 2154.90 10209.99 2930.45 22.30 2154.90 11821.00 3947.52 25.03 2154.90 10854.39 3337.28 1 25.52 2154.90 9114.49 2238.84 19.72 3 ping D. Gross Margin Comparison: In one to two paragraphs, explain why the levels and variability of the gross margin percentages differ for these two firms for Year through Year +5. Provide an example comparing the effect of the change in gross margin. (For example, if gross margin changed from 25% to 35%, what would it mean for each company?)

 please look at section B. please compare the structure of the manufacturing costs of the two firms. in a paragraph.


