Answered step by step
Verified Expert Solution
Question
1 Approved Answer
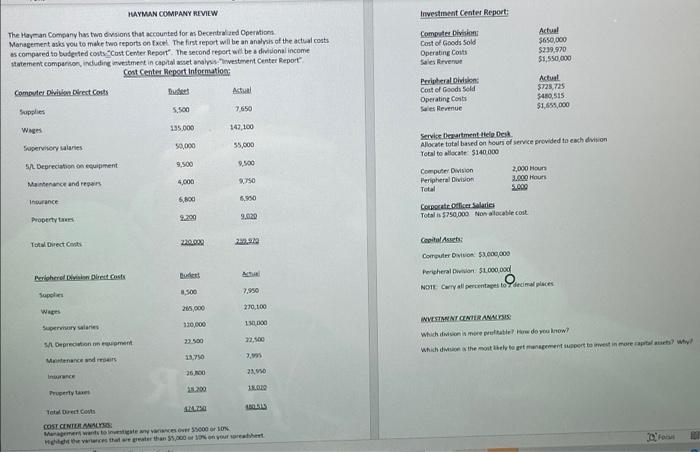
Please make it so i can see all the awnswers! MUAYMAN COMPANY REVIEW Investment Center Report: Computer Division Cost of Goods Sold Operating costs Sales
Please make it so i can see all the awnswers! 


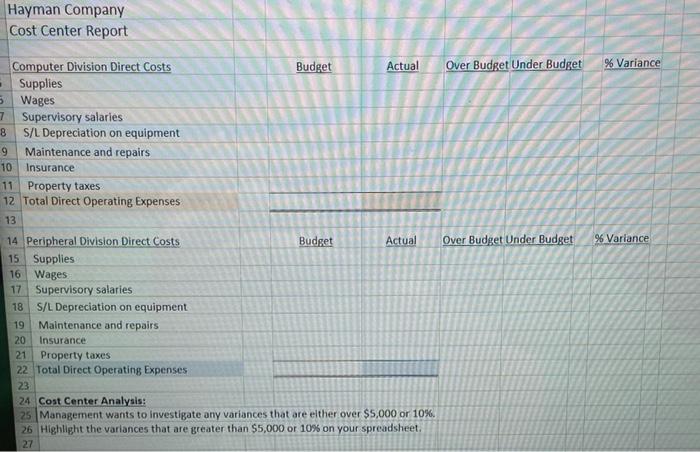
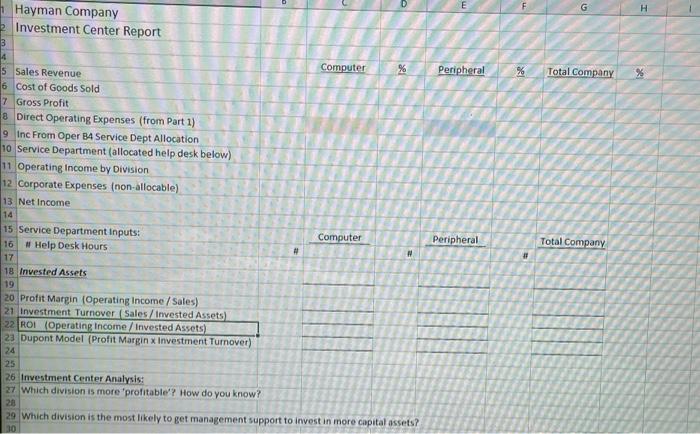
MUAYMAN COMPANY REVIEW Investment Center Report: Computer Division Cost of Goods Sold Operating costs Sales Revenge Actual $650,000 5239.920 $1,550,000 The Mayman Company has two divisions that accounted fores Decentriced Operations Management asks you to make two reports on Excel The first report will be an analysis of the actual costs as compared to bude ted costsCost Center Report the second report will be a divisional income statement comparson, induding investment in capital asset analysvestment Center Report Cost Center Report Information Computer Division Direct Costs tu Supplies 5.500 7650 Wages 135.000 149 100 Supervisory sales 50,000 55,000 Peripheral Division Cost of Goods Sold Operating costs Sales Revue Actual $728.725 $410,515 $1,655,000 SAL Depreciation on equipment 9,500 500 Service ment Help Desk Allocate total based on hours of service provided to each division Total to allocate: $140.000 Computer Division 2,000 Hours Peripheral Division 3.000 Hours Total 5.000 Corporate Officer Salaries Total is $750,000 Non locale cost 970 4,000 Maintenance and repairs Inwrance 60 6,990 Property 9.200 9.920 Tot Director Capital Assets Corouter Don S.CO,000 Perheral Dio $1.000.000 NOTE Carryall percentages to decimal places Peripheral Division et Costs Budett 3.500 7,950 Sopolis 205.000 210.100 130 000 150 000 INVESTMENT CENTER ANALYSIS Which von is more prettierw do you know? which is the most bely to potragement port to rest in more at: why! Sper salaries Depreciation woment Matenance and 23.500 22.500 13710 7.95 26.00 21.050 10.RO Property taxes Totul e Costs AMO COST CENTER ANALYS Management was to new 5000 or 10 Hoteces that water than 35.000 voor het Hayman Company Cost Center Report Over Budget Under Budget % Variance Over Budget Onder Budget % Variance Computer Division Direct Costs Budget Actual Supplies 5 Wages 7 Supervisory salaries 8 S/L Depreciation on equipment 9 Maintenance and repairs 10 Insurance 11 Property taxes 12 Total Direct Operating Expenses 13 14 Peripheral Division Direct Costs Budget Actual 15 Supplies 16 Wages 17 Supervisory salaries 18 S/L Depreciation on equipment 19 Maintenance and repairs 20 Insurance 21 Property taxes 22 Total Direct Operating Expenses 23 24 Cost Center Analysis: 25 Management wants to investigate any variances that are either over $5,000 or 10%. 26 Highlight the variances that are greater than $5,000 or 10% on your spreadsheet. 27 H Hayman Company Investment Center Report 3 Peripheral % Total Company % Computer S Sales Revenue 16 Cost of Goods Sold 7 Gross Profit 8 Direct Operating Expenses (from Part 1) 9 Inc From Oper BA Service Dept Allocation 10 Service Department (allocated help desk below) 11 Operating Income by Division 12 Corporate Expenses (non-allocable) 13 Net Income 14 15 Service Department Inputs: Computer 16 # Help Desk Hours 17 18 Invested Assets 19 20 Profit Margin (Operating Income / Sales) 21 Investment Turnover (Sales/Invested Assets) 22 ROI (Operating Income / Invested Assets) 23 Dupont Model (Profit Margin x Investment Turnover) 24 25 26 Investment Center Analysis 27 Which division is more 'profitable'? How do you know? 20 29 which division is the most likely to get management support to invest in more capital assets? 30 Peripheral Total Company . MUAYMAN COMPANY REVIEW Investment Center Report: Computer Division Cost of Goods Sold Operating costs Sales Revenge Actual $650,000 5239.920 $1,550,000 The Mayman Company has two divisions that accounted fores Decentriced Operations Management asks you to make two reports on Excel The first report will be an analysis of the actual costs as compared to bude ted costsCost Center Report the second report will be a divisional income statement comparson, induding investment in capital asset analysvestment Center Report Cost Center Report Information Computer Division Direct Costs tu Supplies 5.500 7650 Wages 135.000 149 100 Supervisory sales 50,000 55,000 Peripheral Division Cost of Goods Sold Operating costs Sales Revue Actual $728.725 $410,515 $1,655,000 SAL Depreciation on equipment 9,500 500 Service ment Help Desk Allocate total based on hours of service provided to each division Total to allocate: $140.000 Computer Division 2,000 Hours Peripheral Division 3.000 Hours Total 5.000 Corporate Officer Salaries Total is $750,000 Non locale cost 970 4,000 Maintenance and repairs Inwrance 60 6,990 Property 9.200 9.920 Tot Director Capital Assets Corouter Don S.CO,000 Perheral Dio $1.000.000 NOTE Carryall percentages to decimal places Peripheral Division et Costs Budett 3.500 7,950 Sopolis 205.000 210.100 130 000 150 000 INVESTMENT CENTER ANALYSIS Which von is more prettierw do you know? which is the most bely to potragement port to rest in more at: why! Sper salaries Depreciation woment Matenance and 23.500 22.500 13710 7.95 26.00 21.050 10.RO Property taxes Totul e Costs AMO COST CENTER ANALYS Management was to new 5000 or 10 Hoteces that water than 35.000 voor het Hayman Company Cost Center Report Over Budget Under Budget % Variance Over Budget Onder Budget % Variance Computer Division Direct Costs Budget Actual Supplies 5 Wages 7 Supervisory salaries 8 S/L Depreciation on equipment 9 Maintenance and repairs 10 Insurance 11 Property taxes 12 Total Direct Operating Expenses 13 14 Peripheral Division Direct Costs Budget Actual 15 Supplies 16 Wages 17 Supervisory salaries 18 S/L Depreciation on equipment 19 Maintenance and repairs 20 Insurance 21 Property taxes 22 Total Direct Operating Expenses 23 24 Cost Center Analysis: 25 Management wants to investigate any variances that are either over $5,000 or 10%. 26 Highlight the variances that are greater than $5,000 or 10% on your spreadsheet. 27 H Hayman Company Investment Center Report 3 Peripheral % Total Company % Computer S Sales Revenue 16 Cost of Goods Sold 7 Gross Profit 8 Direct Operating Expenses (from Part 1) 9 Inc From Oper BA Service Dept Allocation 10 Service Department (allocated help desk below) 11 Operating Income by Division 12 Corporate Expenses (non-allocable) 13 Net Income 14 15 Service Department Inputs: Computer 16 # Help Desk Hours 17 18 Invested Assets 19 20 Profit Margin (Operating Income / Sales) 21 Investment Turnover (Sales/Invested Assets) 22 ROI (Operating Income / Invested Assets) 23 Dupont Model (Profit Margin x Investment Turnover) 24 25 26 Investment Center Analysis 27 Which division is more 'profitable'? How do you know? 20 29 which division is the most likely to get management support to invest in more capital assets? 30 Peripheral Total Company 


Step by Step Solution
There are 3 Steps involved in it
Step: 1

Get Instant Access to Expert-Tailored Solutions
See step-by-step solutions with expert insights and AI powered tools for academic success
Step: 2

Step: 3

Ace Your Homework with AI
Get the answers you need in no time with our AI-driven, step-by-step assistance
Get Started


