

Answered step by step
Verified Expert Solution
Question
1 Approved Answer
PLEASE NO COPY AND PASTE THE PREVIOUS ANSWER FROM OTHER POSTS HAS THEY ARE WRONG ALSO PLEASE USE R SHUTDOWN FOR THE CORRECT PROCESS THANK
PLEASE NO COPY AND PASTE THE PREVIOUS ANSWER FROM OTHER POSTS HAS THEY ARE WRONG ALSO PLEASE USE R SHUTDOWN FOR THE CORRECT PROCESS
THANK FOR YOUR HARD WORK
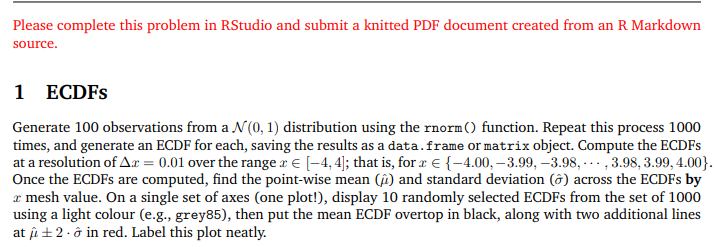
Please complete this problem in RStudio and submit a knitted PDF document created from an R Markdown source. 1 ECDFs Generate 100 observations from a N (0,1) distribution using the rnorm() function. Repeat this process 1000 times, and generate an ECDF for each, saving the results as a data.frame or matrix object. Compute the ECDFs at a resolution of Az = 0.01 over the range -4,4]; that is, for r {-4.00, 3.99, -3.98,-. ,3.98, 3.99, 4.00}. Once the ECDFs are computed, find the point-wise mean (f) and standard deviation (@) across the ECDFs by 2 mesh value. On a single set of axes (one plot!), display 10 randomly selected ECDFs from the set of 1000 using a light colour (e.g., grey85), then put the mean ECDF overtop in black, along with two additional lines at ji +2 . g in red. Label this plot neatlyStep by Step Solution
There are 3 Steps involved in it
Step: 1

Get Instant Access to Expert-Tailored Solutions
See step-by-step solutions with expert insights and AI powered tools for academic success
Step: 2

Step: 3
Ace Your Homework with AI
Get the answers you need in no time with our AI-driven, step-by-step assistance
Get Started
Advanced MySQL 8 Discover The Full Potential Of MySQL And Ensure High Performance Of Your Database
Authors: Eric Vanier ,Birju Shah ,Tejaswi Malepati
1st Edition
1788834445, 978-1788834445