

Answered step by step
Verified Expert Solution
Question
1 Approved Answer
PLEASE ONLY ANSWER #3 The Income statement and balance sheet for HOYT, Inc. are provided below. (Note that the reported figures are expressed in thousands
PLEASE ONLY ANSWER #3 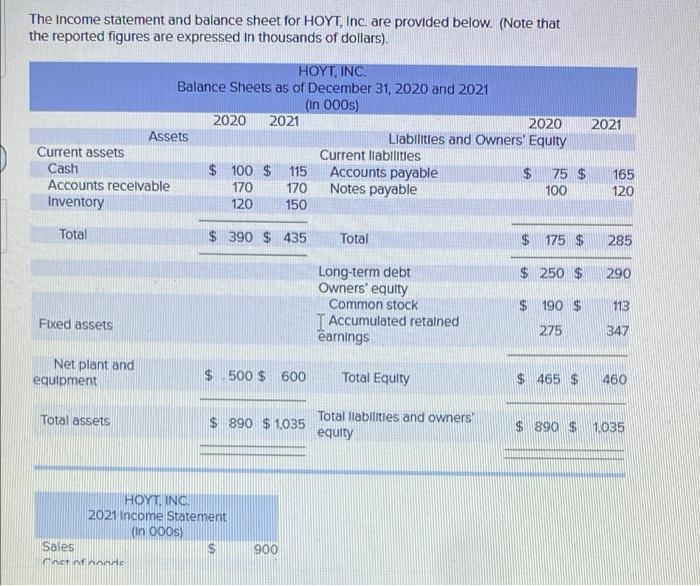
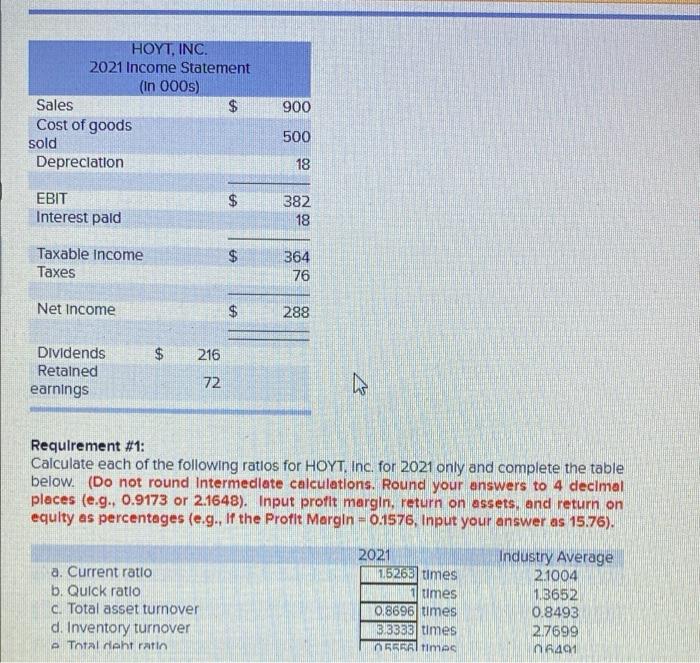
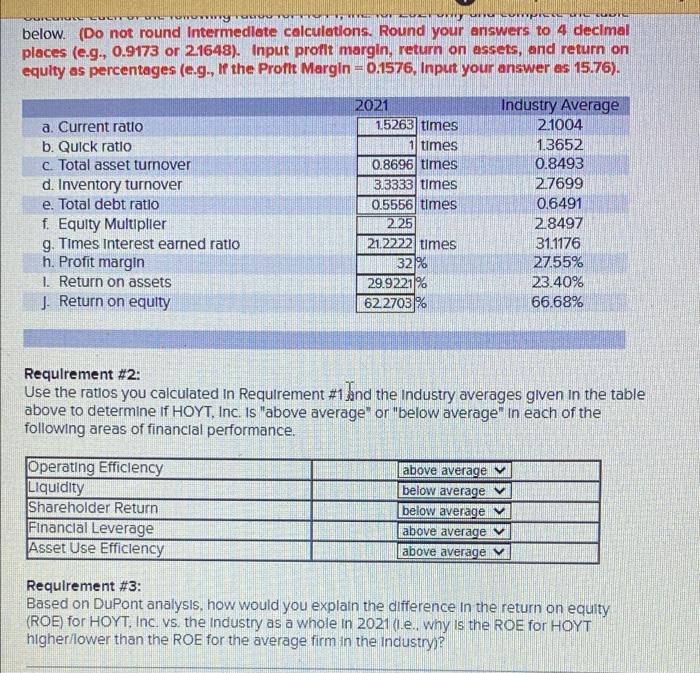
The Income statement and balance sheet for HOYT, Inc. are provided below. (Note that the reported figures are expressed in thousands of dollars). Current assets Cash Accounts receivable Inventory Total Fixed assets Net plant and equipment Total assets HOYT, INC. Balance Sheets as of December 31, 2020 and 2021 (In 000s) Assets Sales Cost of noods 2020 2021 $100 $ 170 120 115 170 150 $390 $ 435 $500 $ 600 $890 $1,035 HOYT, INC. 2021 Income Statement (In 000s) 900 2020 Liabilities and Owners' Equity Current llabilities Accounts payable Notes payable Total Long-term debt Owners' equity Common stock I Accumulated retained earnings Total Equity Total llabilities and owners equity $ 75 $ 100 $175 $ $250 $ $ 190 $ 275 $ 465 $ 2021 165 120 285 290 113 347 460 $890 $ 1,035 HOYT, INC. 2021 Income Statement (In 000s) Sales Cost of goods sold Depreciation EBIT Interest pald Taxable income Taxes Net Income Dividends Retained earnings $ 216 72 $ a. Current ratio b. Quick ratio c. Total asset turnover d. Inventory turnover e Total deht ratio $ $ $ 900 500 18 382 18 364 76 288 k Requirement #1: Calculate each of the following ratlos for HOYT, Inc. for 2021 only and complete the table below. (Do not round Intermediate calculations. Round your answers to 4 decimal places (e.g., 0.9173 or 2.1648). Input profit margin, return on assets, and return on equity as percentages (e.g., If the Profit Margin = 0.1576, Input your answer as 15.76). Industry Average 2.1004 1.3652 0.8493 2.7699 06491 2021 1.5263 times times 0.8696 times 3.3333 times 055561 times Corcora for UE, only una comprens below. (Do not round Intermediate calculations. Round your answers to 4 decimal places (e.g., 0.9173 or 2.1648). Input profit margin, return on assets, and return on equity as percentages (e.g., If the Profit Margin = 0.1576, Input your answer as 15.76). Industry Average a. Current ratio b. Quick ratio c. Total asset turnover d. Inventory turnover e. Total debt ratio GOOG f. Equity Multiplier g. Times Interest earned ratio h. Profit margin 1. Return on assets J. Return on equity Operating Efficiency Liquidity Shareholder Return Financial Leverage Asset Use Efficiency 2021 1.5263 times 1 times 0.8696 times 3.3333 times 0.5556 times 225 21.2222 times 32% 29.9221% 622703% Requirement #2: Use the ratlos you calculated in Requirement #1 and the Industry averages given in the table above to determine if HOYT, Inc. Is "above average" or "below average" In each of the following areas of financial performance. 2.1004 1.3652 0.8493 2.7699 0.6491 2.8497 31.1176 27.55% 23.40% 66.68% above average below average V below average above average V above average Requirement #3: Based on DuPont analysis, how would you explain the difference in the return on equity (ROE) for HOYT, Inc. vs. the Industry as a whole in 2021 (1.e.. why is the ROE for HOYT higher/lower than the ROE for the average firm in the Industry) Step by Step Solution
There are 3 Steps involved in it
Step: 1

Get Instant Access to Expert-Tailored Solutions
See step-by-step solutions with expert insights and AI powered tools for academic success
Step: 2

Step: 3
Ace Your Homework with AI
Get the answers you need in no time with our AI-driven, step-by-step assistance
Get Started
The Risk Modeling Evaluation Handbook Rethinking Financial Risk Management Methodologies In The Global Capital Markets
Authors: Greg Gregoriou, Christian Hoppe, Carsten Wehn
1st Edition
0071663703, 978-0071663700