

Answered step by step
Verified Expert Solution
Question
1 Approved Answer
Please post Matlab code as well. Thanks! 5. Consider the ordinary differential equation Y = -2 + 5y? y. (a) Use the MATLAB function plot
Please post Matlab code as well. Thanks!
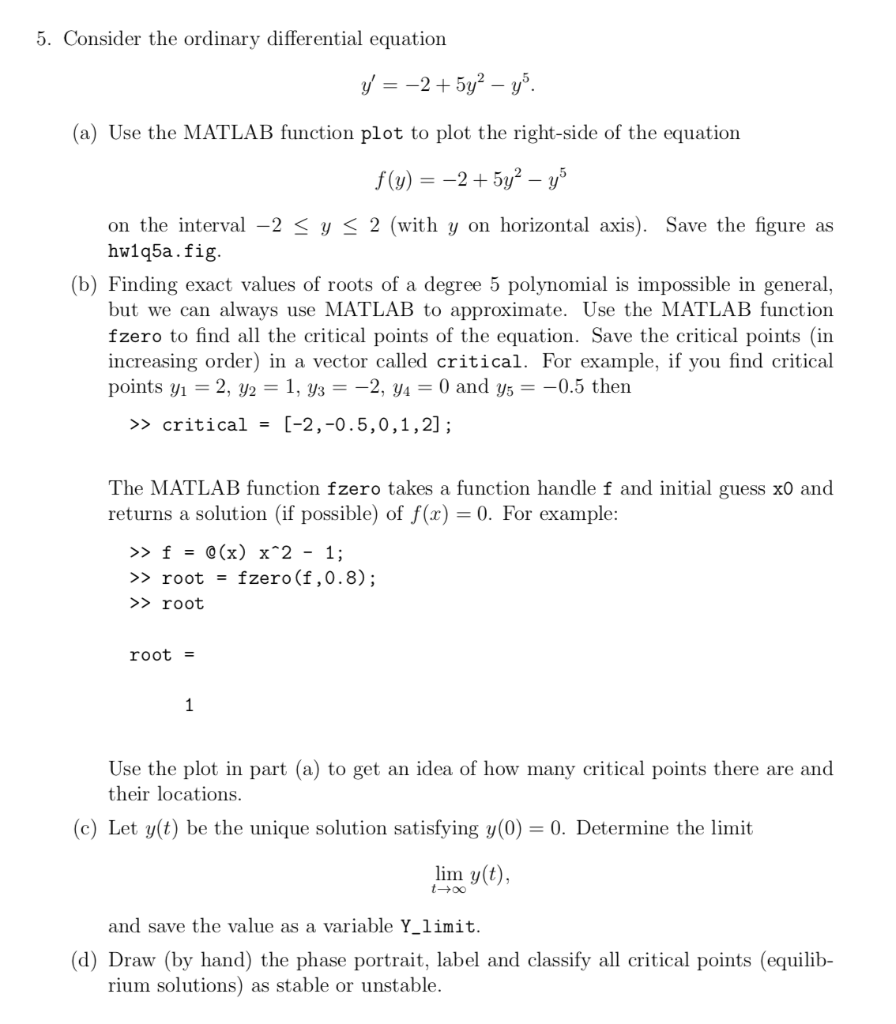
5. Consider the ordinary differential equation Y = -2 + 5y? y. (a) Use the MATLAB function plot to plot the right-side of the equation f(y) = -2+ 5y y5 on the interval -2 > critical = [-2,-0.5,0,1,2]; The MATLAB function fzero takes a function handle f and initial guess x0 and returns a solution (if possible) of f(x) = 0. For example: >> f = @(x) x^2 - 1; >> root = fzero(f,0.8); >> root root = 1 Use the plot in part (a) to get an idea of how many critical points there are and their locations. (c) Let y(t) be the unique solution satisfying y(0) = 0. Determine the limit lim y(t), and save the value as a variable Y_limit. (d) Draw (by hand) the phase portrait, label and classify all critical points (equilib- rium solutions) as stable or unstableStep by Step Solution
There are 3 Steps involved in it
Step: 1

Get Instant Access to Expert-Tailored Solutions
See step-by-step solutions with expert insights and AI powered tools for academic success
Step: 2

Step: 3
Ace Your Homework with AI
Get the answers you need in no time with our AI-driven, step-by-step assistance
Get Started
Pro SQL Server Wait Statistics
Authors: Enrico Van De Laar
1st Edition
1484211391, 9781484211397