Answered step by step
Verified Expert Solution
Question
1 Approved Answer
Please prepare a PowerPoint presentation about Response Surface Methodology on Minitab by applying Response Surface Methodology on Minitab and send me the screenshots. You can
Please prepare a PowerPoint presentation about "Response Surface Methodology on Minitab" by applying Response Surface Methodology on Minitab and send me the screenshots. You can also use the images I sent to prepare the PowerPoint presentation.
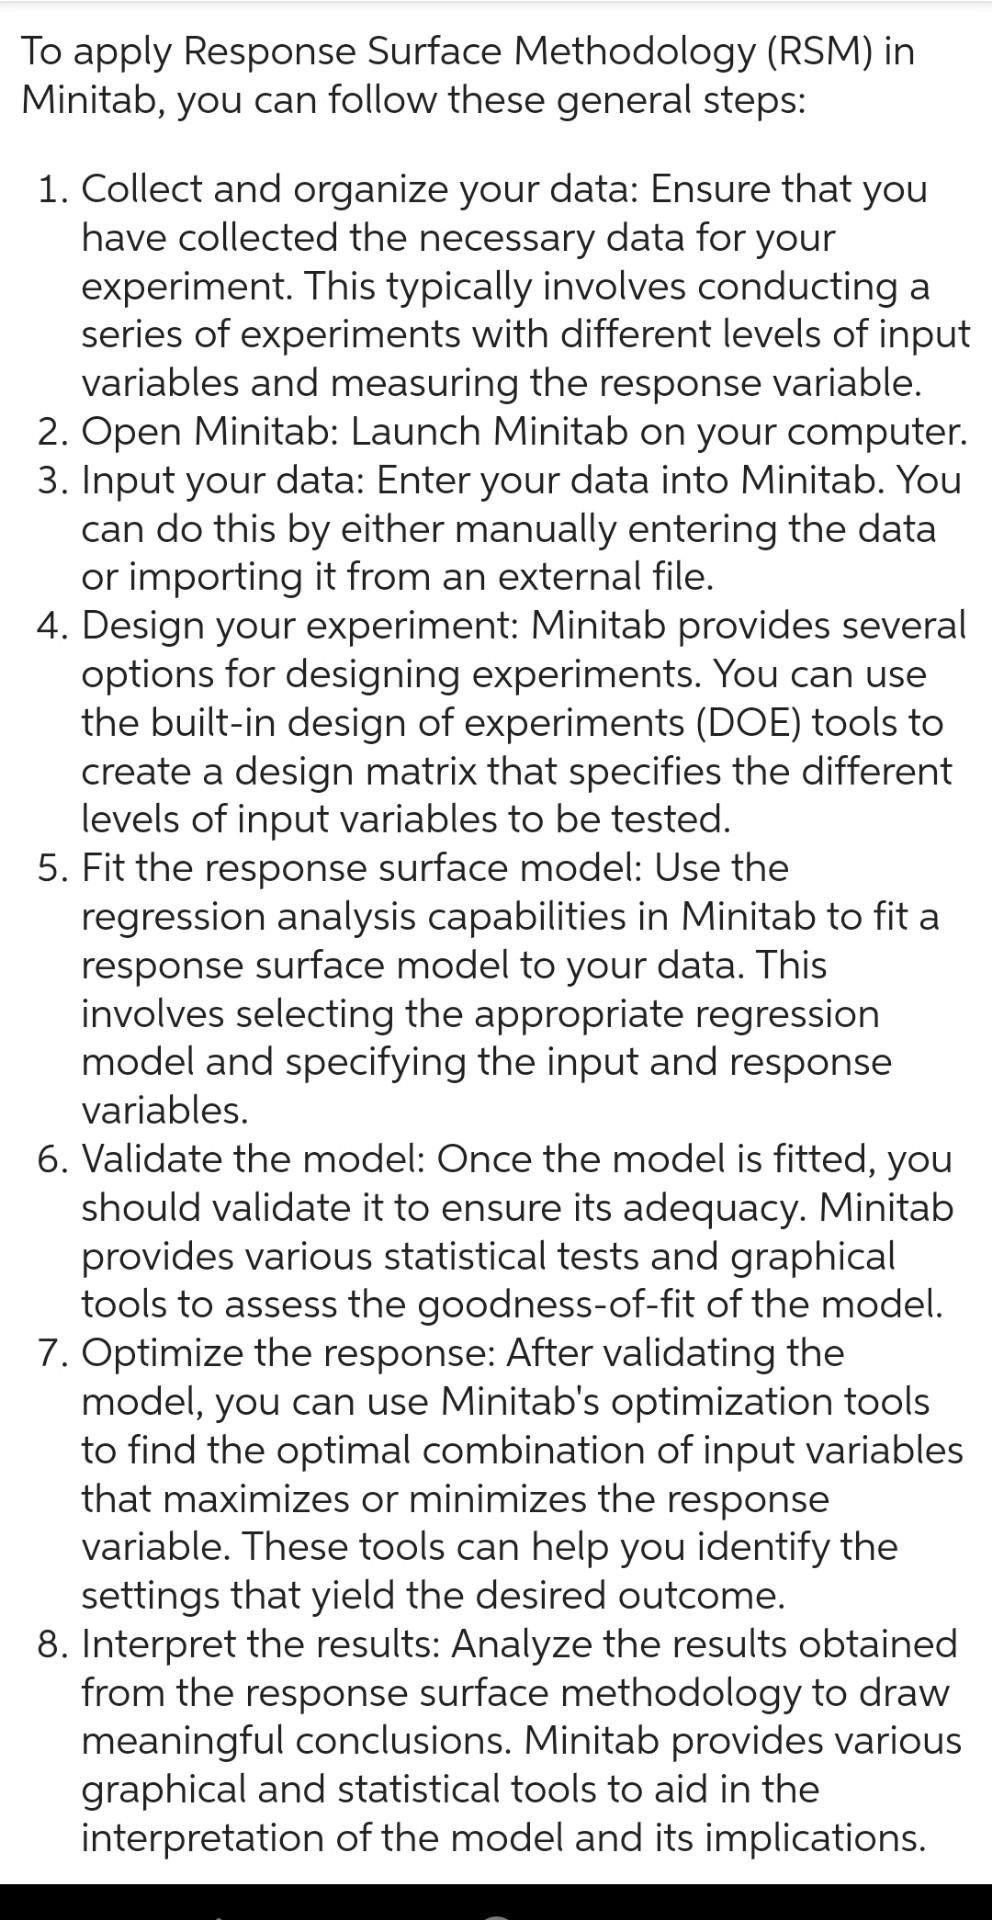
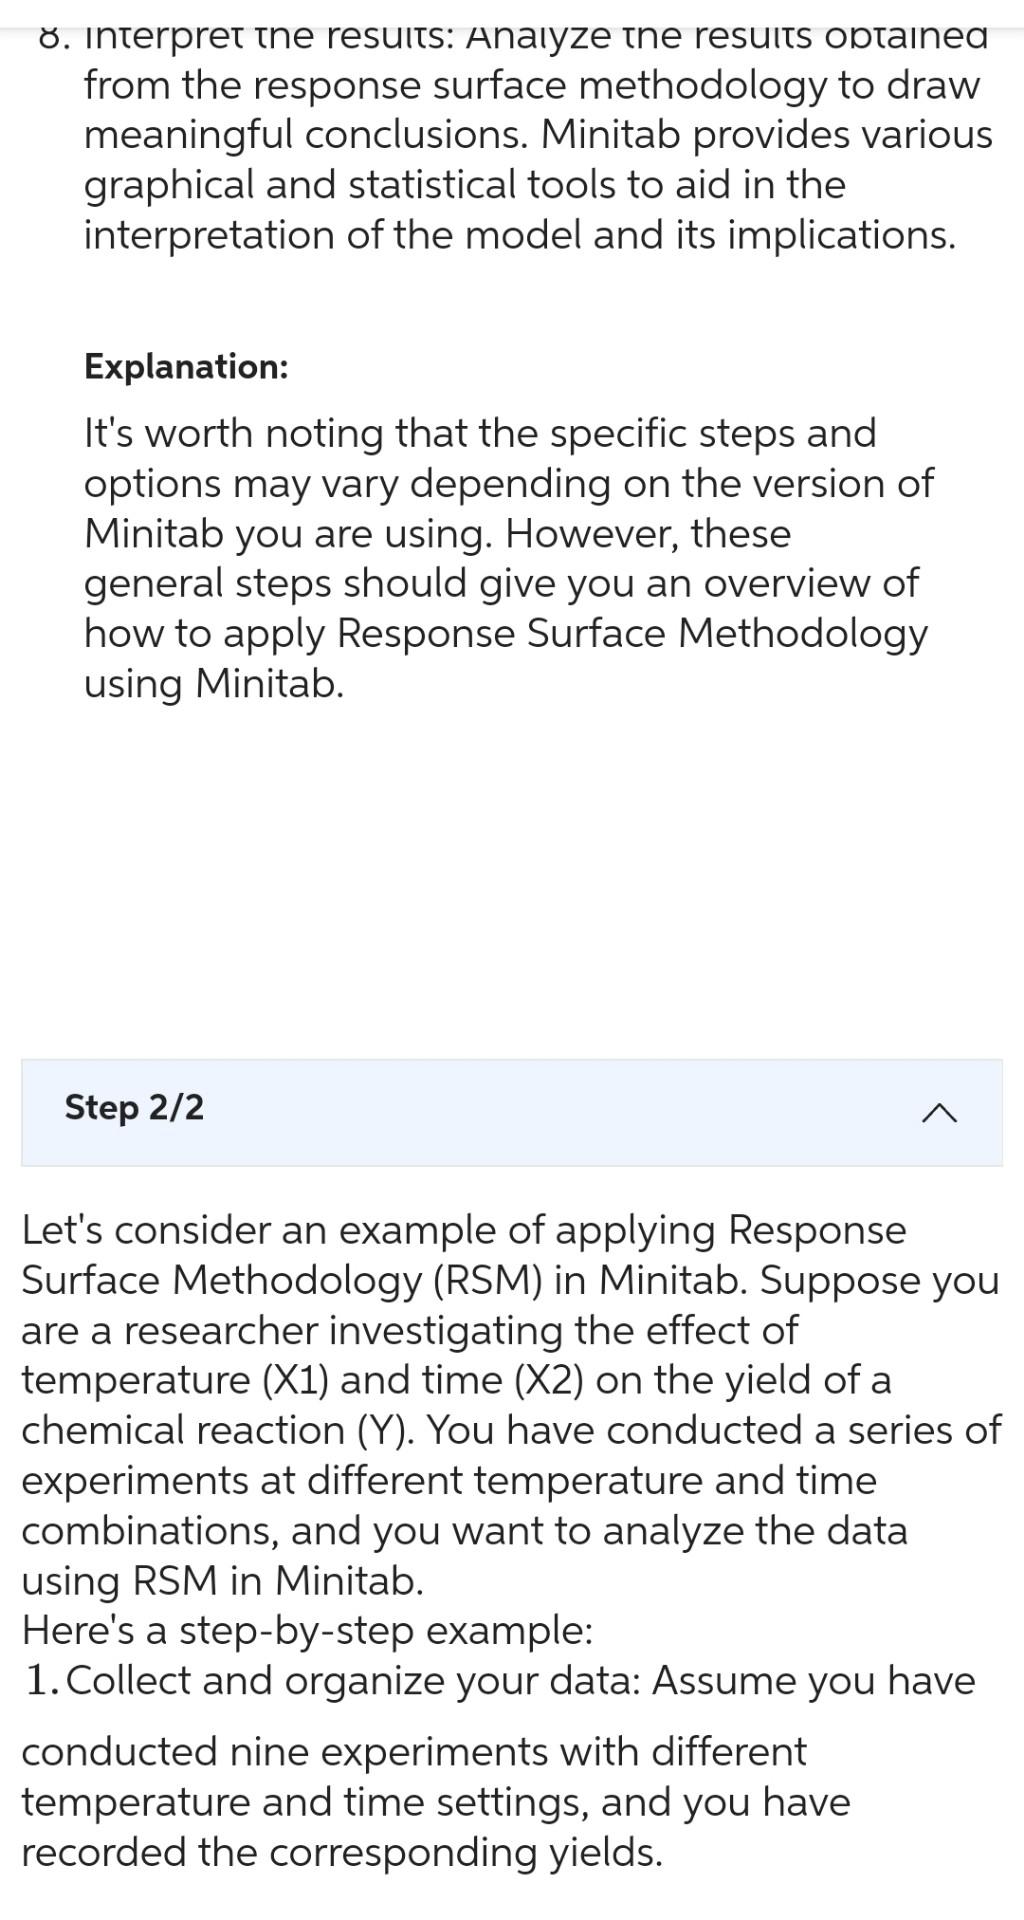
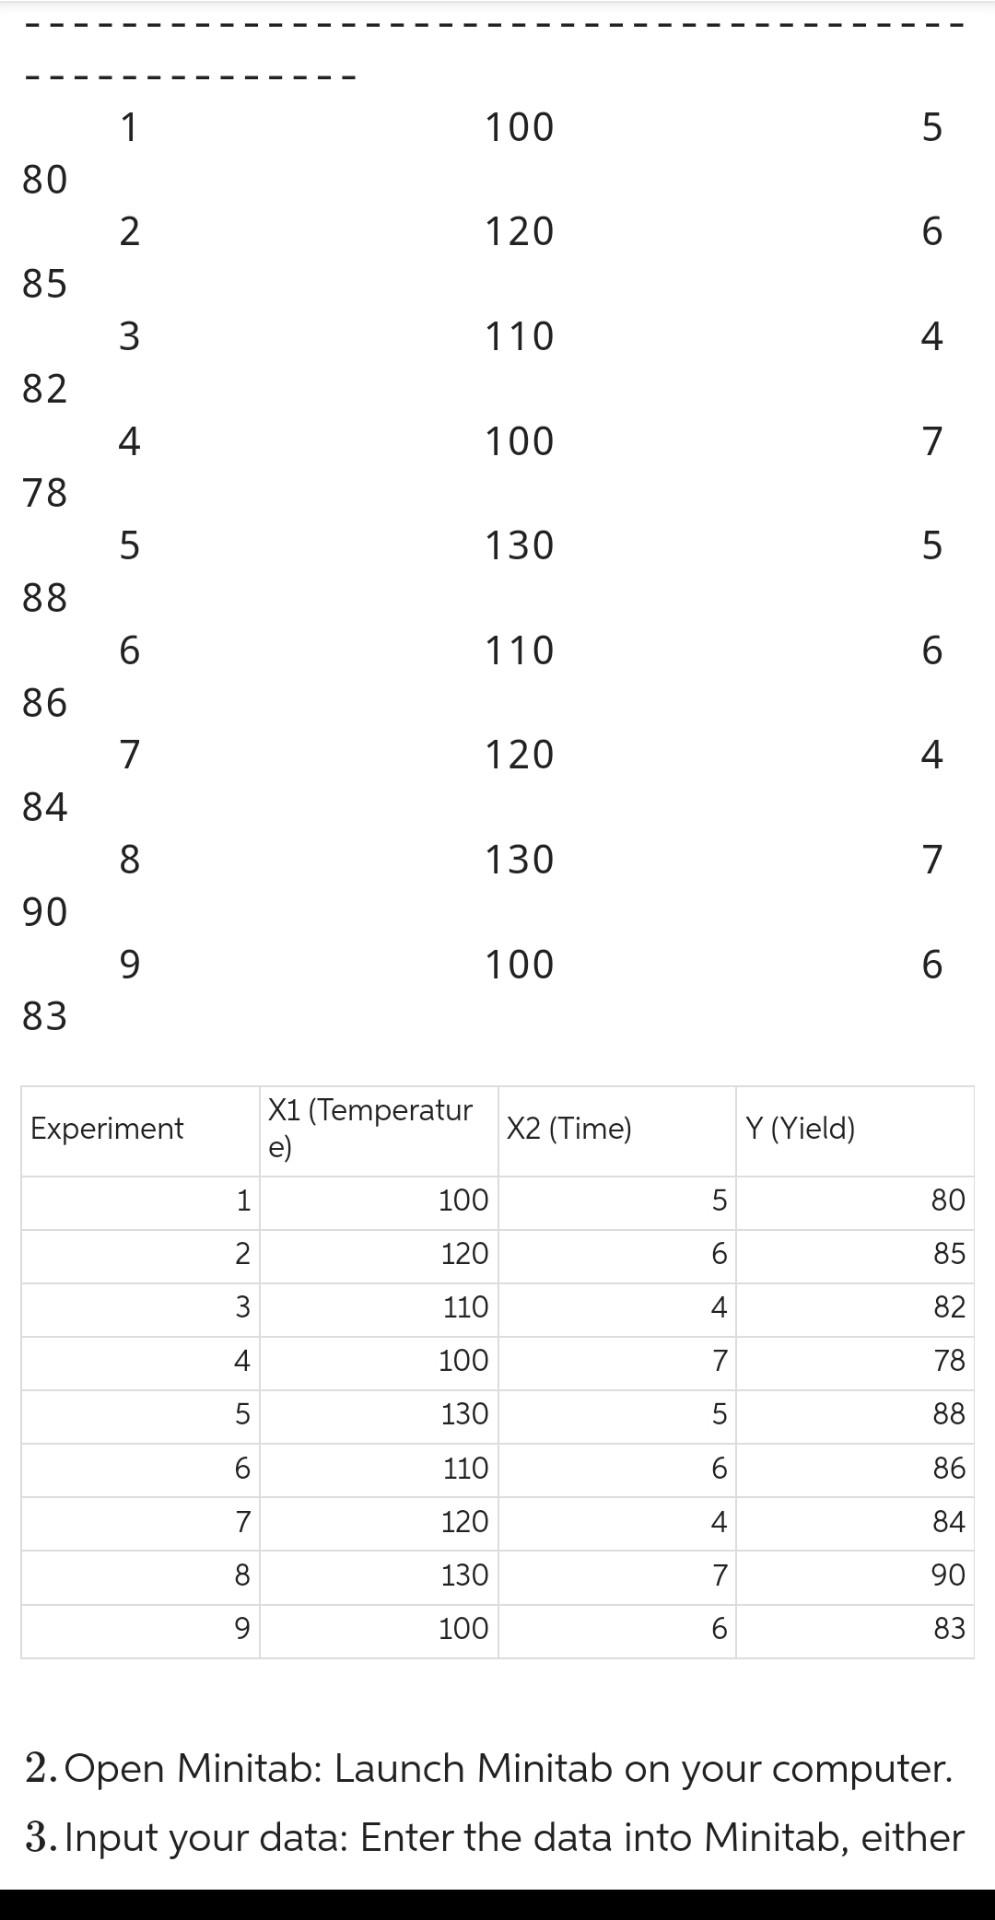
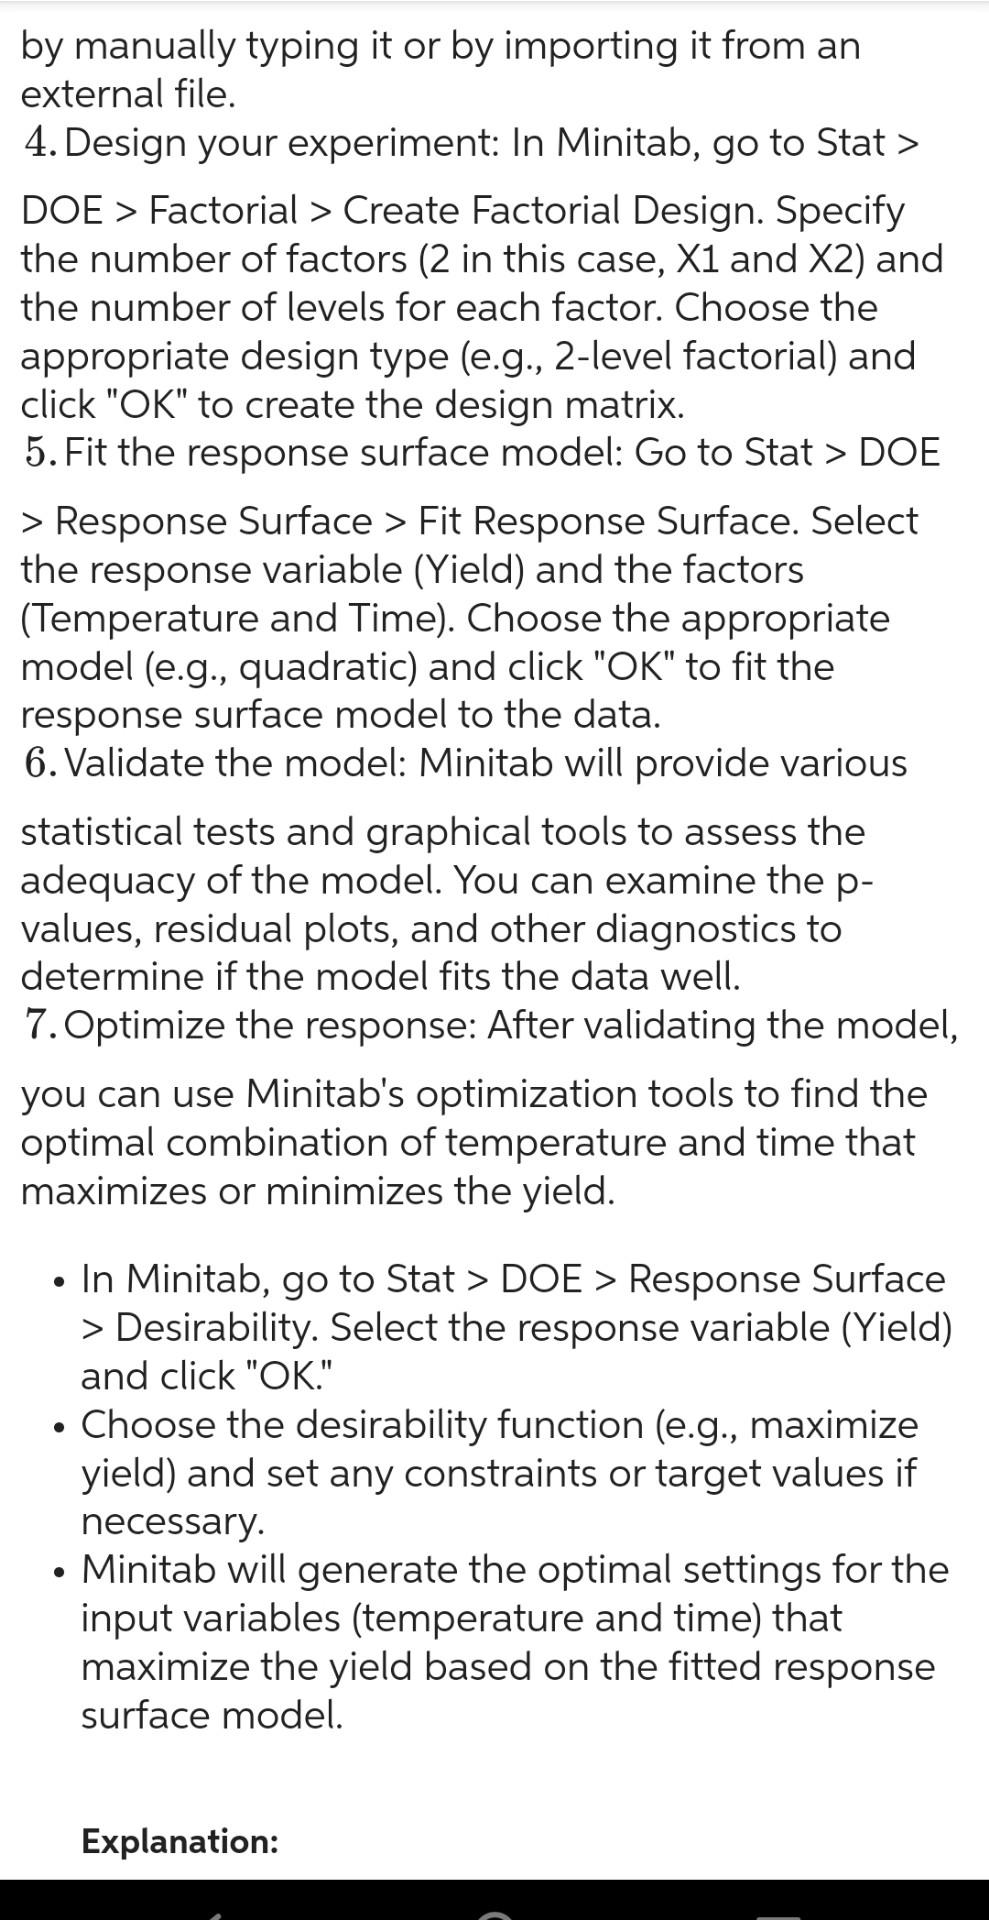
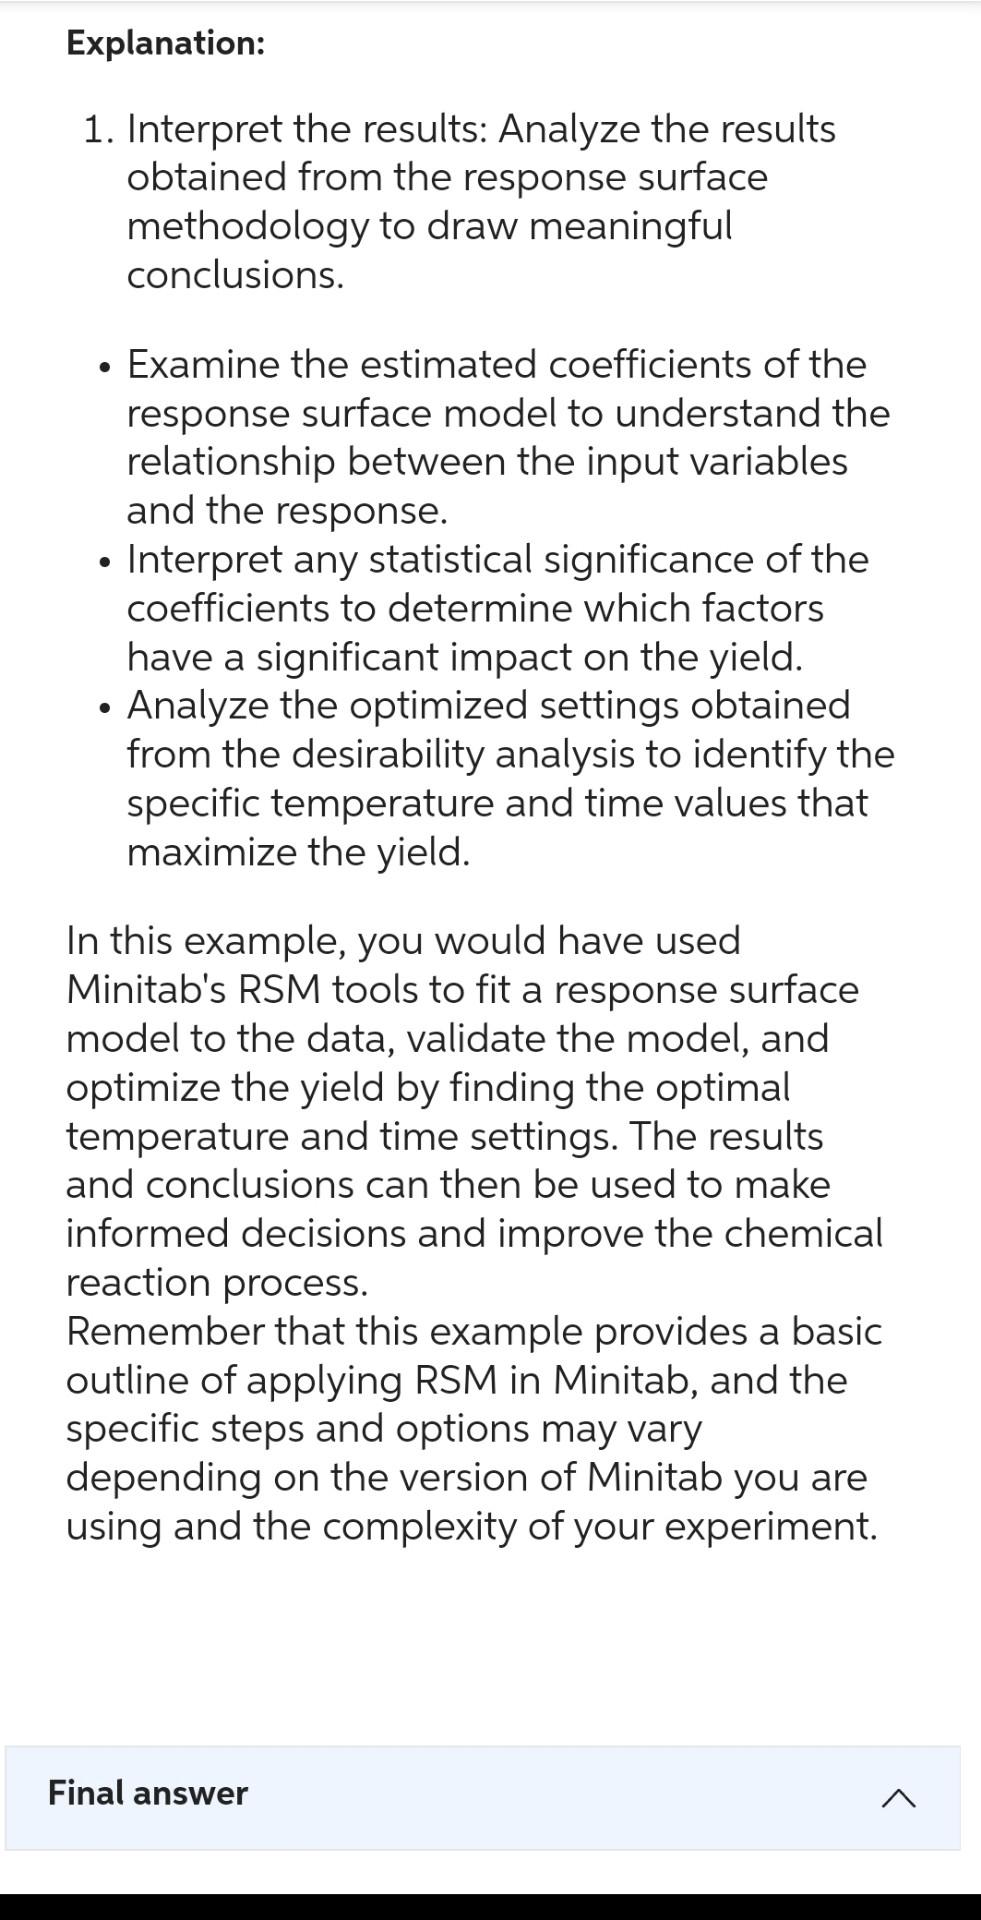
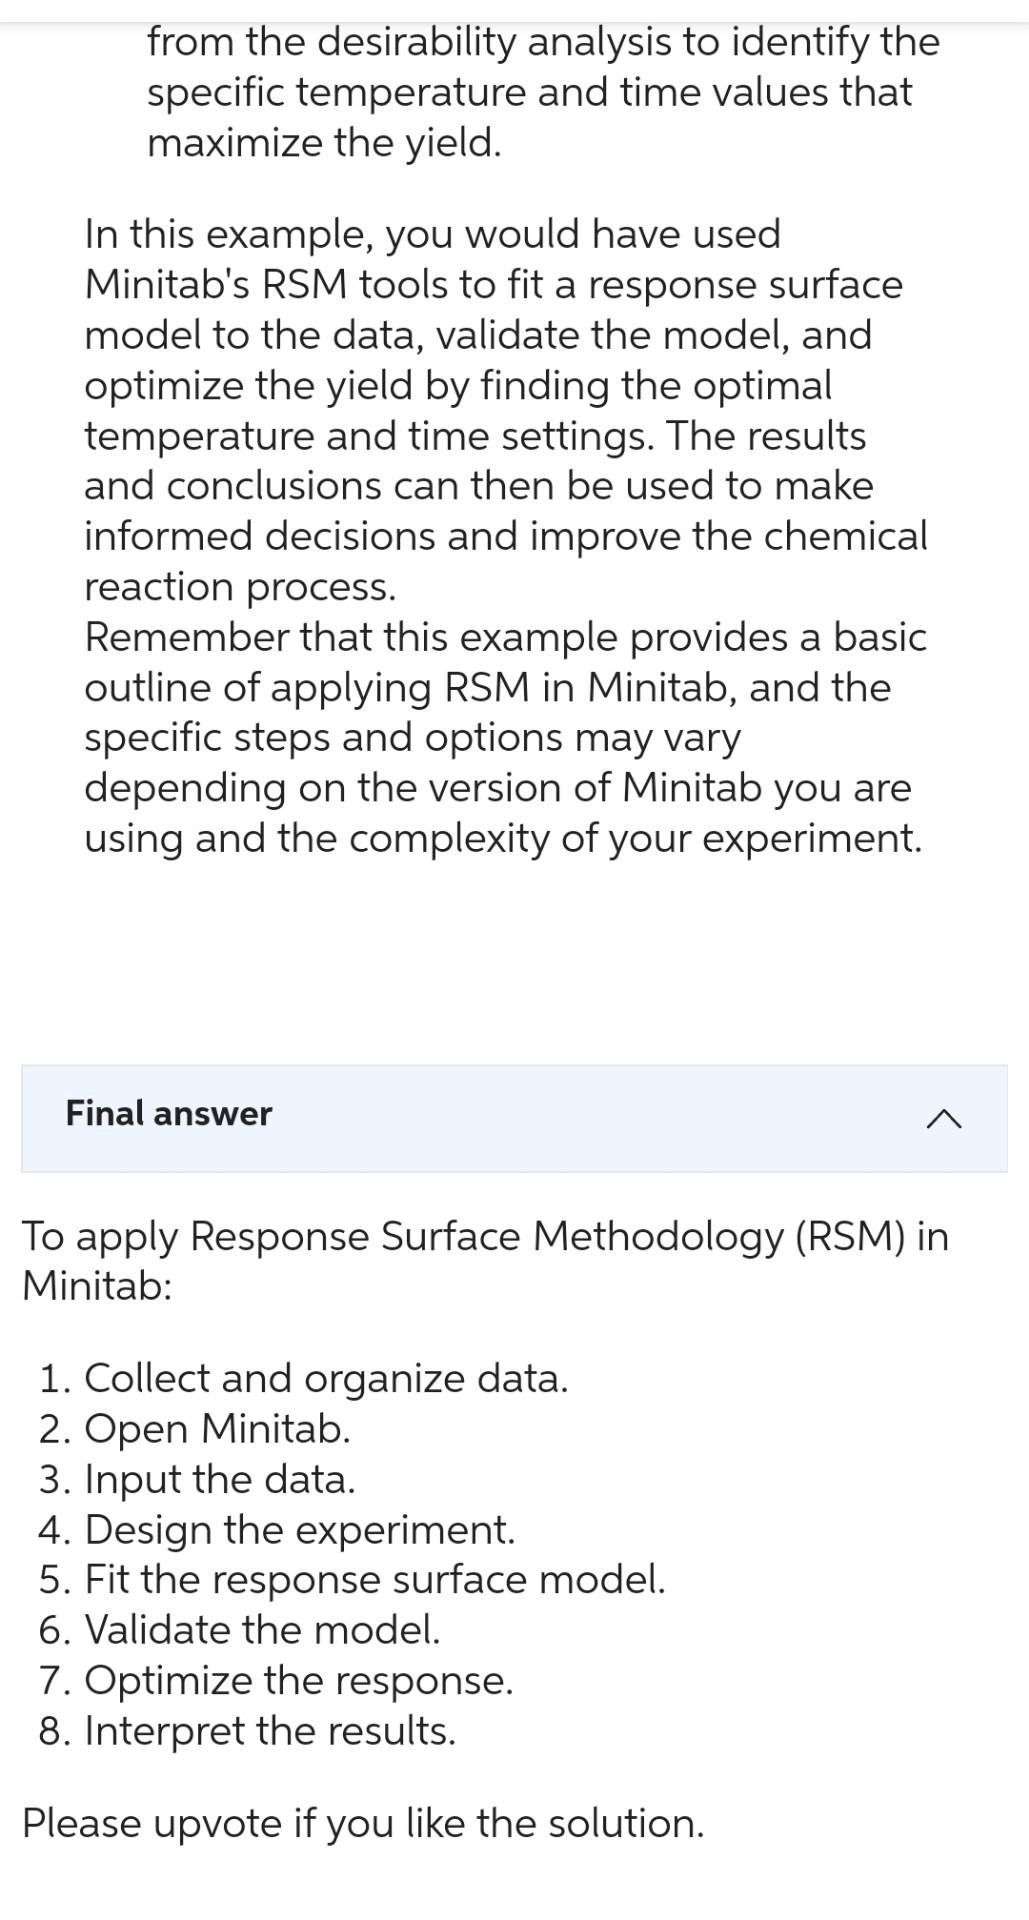
To apply Response Surface Methodology (RSM) in Minitab, you can follow these general steps: 1. Collect and organize your data: Ensure that you have collected the necessary data for your experiment. This typically involves conducting a series of experiments with different levels of input variables and measuring the response variable. 2. Open Minitab: Launch Minitab on your computer. 3. Input your data: Enter your data into Minitab. You can do this by either manually entering the data or importing it from an external file. 4. Design your experiment: Minitab provides several options for designing experiments. You can use the built-in design of experiments (DOE) tools to create a design matrix that specifies the different levels of input variables to be tested. 5. Fit the response surface model: Use the regression analysis capabilities in Minitab to fit a response surface model to your data. This involves selecting the appropriate regression model and specifying the input and response variables. 6. Validate the model: Once the model is fitted, you should validate it to ensure its adequacy. Minitab provides various statistical tests and graphical tools to assess the goodness-of-fit of the model. 7. Optimize the response: After validating the model, you can use Minitab's optimization tools to find the optimal combination of input variables that maximizes or minimizes the response variable. These tools can help you identify the settings that yield the desired outcome. 8. Interpret the results: Analyze the results obtained from the response surface methodology to draw meaningful conclusions. Minitab provides various graphical and statistical tools to aid in the interpretation of the model and its implications. . Interpret the results: Analyze the resuits obtanea from the response surface methodology to draw meaningful conclusions. Minitab provides various graphical and statistical tools to aid in the interpretation of the model and its implications. Explanation: It's worth noting that the specific steps and options may vary depending on the version of Minitab you are using. However, these general steps should give you an overview of how to apply Response Surface Methodology using Minitab. Step 2/2 Let's consider an example of applying Response Surface Methodology (RSM) in Minitab. Suppose you are a researcher investigating the effect of temperature (X1) and time (X2) on the yield of a chemical reaction (Y). You have conducted a series of experiments at different temperature and time combinations, and you want to analyze the data using RSM in Minitab. Here's a step-by-step example: 1. Collect and organize your data: Assume you have conducted nine experiments with different temperature and time settings, and you have recorded the corresponding yields. 2. Open Minitab: Launch Minitab on your computer. 3. Input your data: Enter the data into Minitab, either by manually typing it or by importing it from an external file. 4. Design your experiment: In Minitab, go to Stat > DOE > Factorial > Create Factorial Design. Specify the number of factors ( 2 in this case, X1 and X2 ) and the number of levels for each factor. Choose the appropriate design type (e.g., 2-level factorial) and click "OK" to create the design matrix. 5. Fit the response surface model: Go to Stat > DOE > Response Surface > Fit Response Surface. Select the response variable (Yield) and the factors (Temperature and Time). Choose the appropriate model (e.g., quadratic) and click "OK" to fit the response surface model to the data. 6. Validate the model: Minitab will provide various statistical tests and graphical tools to assess the adequacy of the model. You can examine the pvalues, residual plots, and other diagnostics to determine if the model fits the data well. 7. Optimize the response: After validating the model, you can use Minitab's optimization tools to find the optimal combination of temperature and time that maximizes or minimizes the yield. - In Minitab, go to Stat > DOE > Response Surface > Desirability. Select the response variable (Yield) and click "OK." - Choose the desirability function (e.g., maximize yield) and set any constraints or target values if necessary. - Minitab will generate the optimal settings for the input variables (temperature and time) that maximize the yield based on the fitted response surface model. Explanation: Explanation: 1. Interpret the results: Analyze the results obtained from the response surface methodology to draw meaningful conclusions. - Examine the estimated coefficients of the response surface model to understand the relationship between the input variables and the response. - Interpret any statistical significance of the coefficients to determine which factors have a significant impact on the yield. - Analyze the optimized settings obtained from the desirability analysis to identify the specific temperature and time values that maximize the yield. In this example, you would have used Minitab's RSM tools to fit a response surface model to the data, validate the model, and optimize the yield by finding the optimal temperature and time settings. The results and conclusions can then be used to make informed decisions and improve the chemical reaction process. Remember that this example provides a basic outline of applying RSM in Minitab, and the specific steps and options may vary depending on the version of Minitab you are using and the complexity of your experiment. specific temperature and time values that maximize the yield. In this example, you would have used Minitab's RSM tools to fit a response surface model to the data, validate the model, and optimize the yield by finding the optimal temperature and time settings. The results and conclusions can then be used to make informed decisions and improve the chemical reaction process. Remember that this example provides a basic outline of applying RSM in Minitab, and the specific steps and options may vary depending on the version of Minitab you are using and the complexity of your experiment. Final answer To apply Response Surface Methodology (RSM) in Minitab: 1. Collect and organize data. 2. Open Minitab. 3. Input the data. 4. Design the experiment. 5. Fit the response surface model. 6. Validate the model. 7. Optimize the response. 8. Interpret the results. Please upvote if you like the solution
Step by Step Solution
There are 3 Steps involved in it
Step: 1

Get Instant Access to Expert-Tailored Solutions
See step-by-step solutions with expert insights and AI powered tools for academic success
Step: 2

Step: 3

Ace Your Homework with AI
Get the answers you need in no time with our AI-driven, step-by-step assistance
Get Started


