Please probide the excel formulas used to enter each box. thanks.
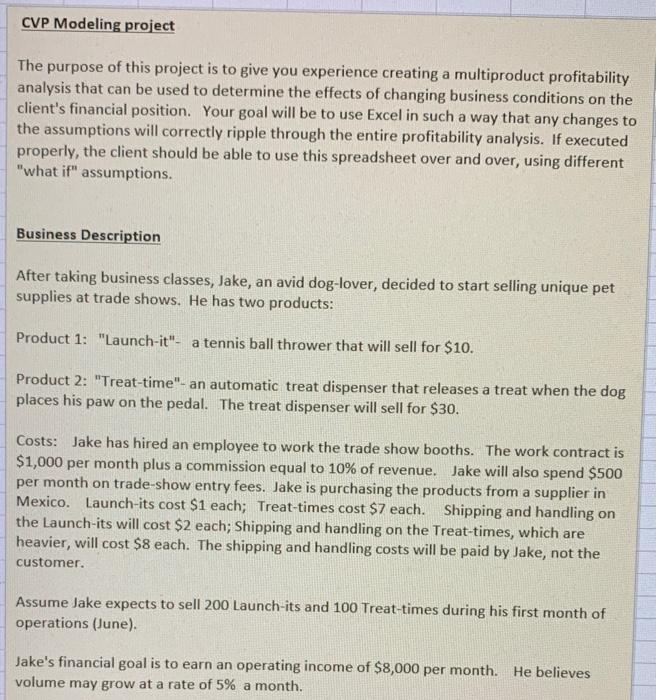
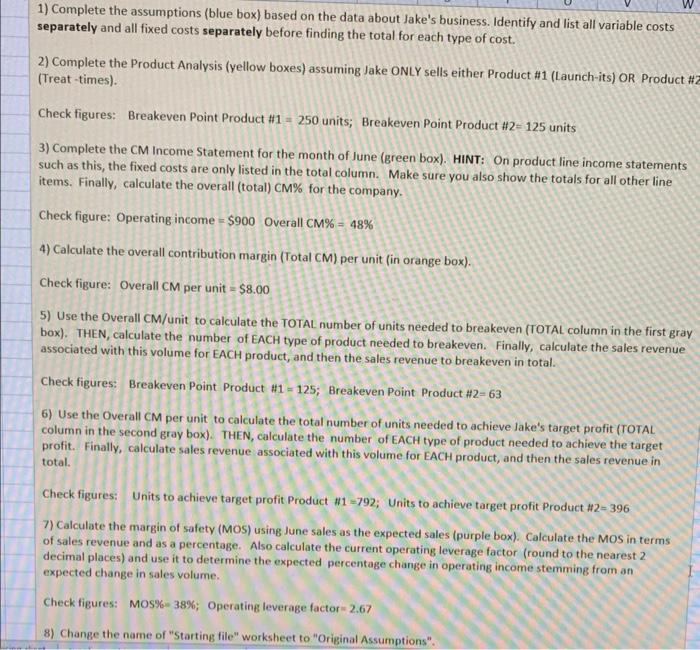
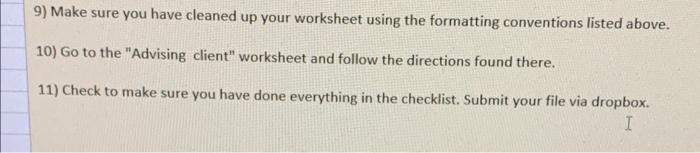
CVP Modeling project The purpose of this project is to give you experience creating a multiproduct profitability analysis that can be used to determine the effects of changing business conditions on the client's financial position. Your goal will be to use Excel in such a way that any changes to the assumptions will correctly ripple through the entire profitability analysis. If executed properly, the client should be able to use this spreadsheet over and over, using different "what if" assumptions. Business Description After taking business classes, Jake, an avid dog-lover, decided to start selling unique pet supplies at trade shows. He has two products: Product 1: "Launch-it" - a tennis ball thrower that will sell for $10. Product 2: "Treat-time"- an automatic treat dispenser that releases a treat when the dog places his paw on the pedal. The treat dispenser will sell for $30. Costs: Jake has hired an employee to work the trade show booths. The work contract is $1,000 per month plus a commission equal to 10% of revenue. Jake will also spend $500 per month on trade-show entry fees. Jake is purchasing the products from a supplier in Mexico. Launch-its cost \$1 each; Treat-times cost $7 each. Shipping and handling on the Launch-its will cost \$2 each; Shipping and handling on the Treat-times, which are heavier, will cost $8 each. The shipping and handling costs will be paid by Jake, not the customer. Assume Jake expects to sell 200 Launch-its and 100 Treat-times during his first month of operations (June). Jake's financial goal is to earn an operating income of $8,000 per month. He believes volume may grow at a rate of 5% a month. 1) Complete the assumptions (blue box) based on the data about Jake's business. Identify and list all variable costs separately and all fixed costs separately before finding the total for each type of cost. 2) Complete the Product Analysis (yellow boxes) assuming Jake ONLY sells either Product \#1 (Laurich-its) OR Product \# (Treat-times). Check figures: Breakeven Point Product #1=250 units; Breakeven Point Product #2=125 units 3) Complete the CM Income Statement for the month of June (green box). HINT: On product line income statements such as this, the fixed costs are only listed in the total column. Make sure you also show the totals for all other line items. Finally, calculate the overall (total) CM\% for the company. Check figure: Operating income =$900 Overall CM%=48% 4) Calculate the overall contribution margin (Total CM) per unit (in orange box). Check figure: Overall CM per unit =$8.00 5) Use the Overall CM/unit to calculate the TOTAL number of units needed to breakeven (TOTAL column in the first gray box). THEN, calculate the number of EACH type of product needed to breakeven. Finally, calculate the sales revenue associated with this volume for EACH product, and then the sales revenue to breakeven in total. Check figures: Breakeven Point Product #1=125; Breakeven Point Product #2=63 6) Use the Overall CM per unit to calculate the total number of units needed to achieve Jake's target profit (TOTAL column in the second gray box). THEN, calculate the number of EACH type of product needed to achieve the target profit. Finally, calculate sales revenue associated with this volume for EACH product, and then the sales revenue in total. Check figures: Units to achieve target profit Product #1=792; Units to achieve target profit Product #2=396 7) Calculate the margin of safety (MOS) using June sales as the expected sales (purple box). Calculate the MOS in terms of sales revenue and as a percentage. Also calculate the current operating leverage factor (round to the nearest 2 decimal places) and use it to determine the expected percentage change in operating income stemming from an expected change in sales volume. Check figures: MOS\%= 38\%; Operating leverage factor =2.67 8) Change the name of "Starting file" worksheet to "Original Assumptions". 9) Make sure you have cleaned up your worksheet using the formatting conventions listed above. 10) Go to the "Advising client" worksheet and follow the directions found there. 11) Check to make sure you have done everything in the checklist. Submit your file via dropbox. the ditell