 Please provide instructions
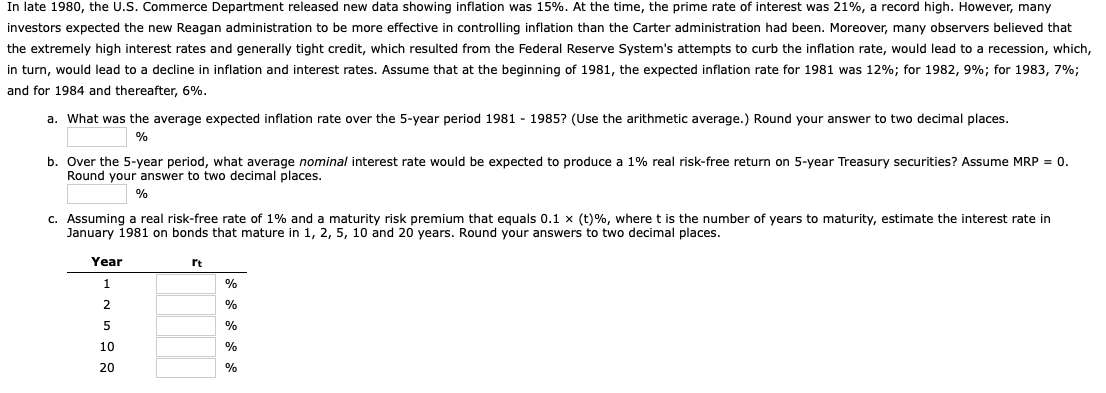
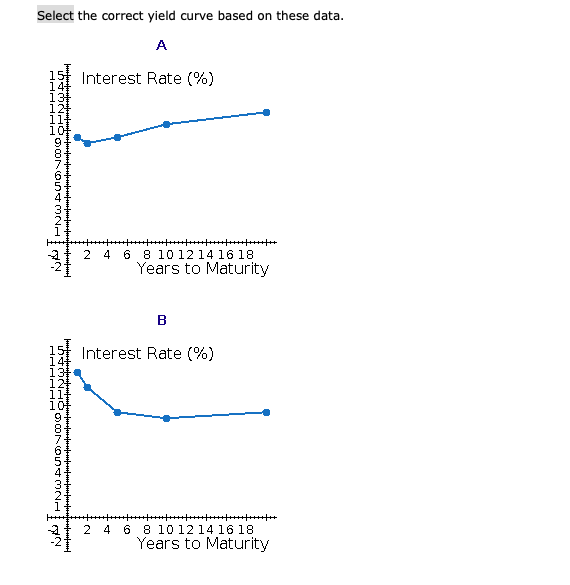
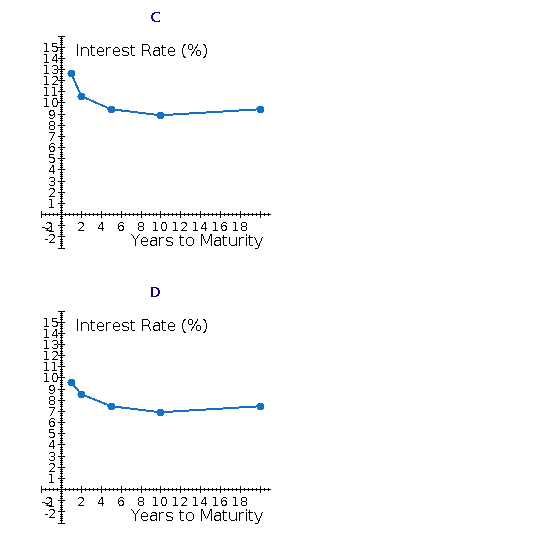
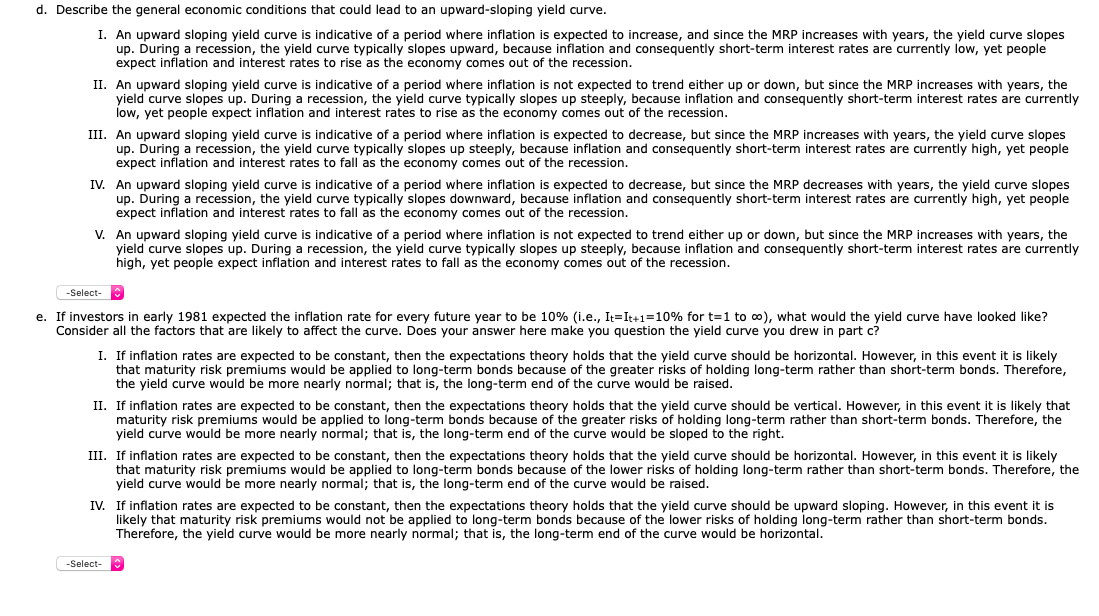
In late 1980, the U.S. Commerce Department released new data showing inflation was 15%. At the time, the prime rate of interest was 21%, a record high. However, many investors expected the new Reagan administration to be more effective in controlling inflation than the Carter administration had been. Moreover, many observers believed that the extremely high interest rates and generally tight credit, which resulted from the Federal Reserve System's attempts to curb the inflation rate, would lead to a recession, which, in turn, would lead to a decline in inflation and interest rates. Assume that at the beginning of 1981, the expected inflation rate for 1981 was 12%; for 1982, 9%; for 1983, 7%; and for 1984 and thereafter, 6%. a. What was the average expected inflation rate over the 5-year period 1981 - 1985? (Use the arithmetic average.) Round your answer to two decimal places. % b. Over the 5-year period, what average nominal interest rate would be expected to produce a 1% real risk-free return on 5-year Treasury securities? Assume MRP = 0. Round your answer to two decimal places. % C. Assuming a real risk-free rate of 1% and a maturity risk premium that equals 0.1 x (t)%, where t is the number of years to maturity, estimate the interest rate in January 1981 on bonds that mature in 1, 2, 5, 10 and 20 years. Round your answers to two decimal places. Year rt 1 % 2 % 5 % 10 % 20 % Select the correct yield curve based on these data. A Interest Rate (%) 1 14 134 121 11 101 2 NA 4 6 8 10 12 14 16 18 Years to Maturity B 151 Interest Rate (%) 141 131 12 11 101 2 4 | 6 8 10 12 14 16 18 Years to Maturity C 151 Interest Rate (%) 141 134 12 111 101 3 1 2 4 6 8 10 12 14 16 18 Years to Maturity D 15 Interest Rate (%) 14 131 121 111 10 NA-Nw. 2 4 6 8 10 12 14 16 18 Years to Maturity d. Describe the general economic conditions that could lead to an upward-sloping yield curve. I. An upward sloping yield curve is indicative of a period where inflation is expected to increase, and since the MRP increases with years, the yield curve slopes up. During a recession, the yield curve typically slopes upward, because inflation and consequently short-term interest rates are currently low, yet people expect inflation and interest rates to rise as the economy comes out of the recession. II. An upward sloping yield curve is indicative of a period where inflation is not expected to trend either up or down, but since the MRP increases with years, the yield curve slopes up. During a recession, the yield curve typically slopes up steeply, because inflation and consequently short-term interest rates are currently low, yet people expect inflation and interest rates to rise as the economy comes out of the recession. III. An upward sloping yield curve is indicative of a period where inflation is expected to decrease, but since the MRP increases with years, the yield curve slopes up. During a recession, the yield curve typically slopes up steeply, because inflation and consequently short-term interest rates are currently high, yet people expect inflation and interest rates to fall as the economy comes out of the recession. IV. An upward sloping yield curve is indicative of a period where inflation is expected to decrease, but since the MRP decreases with years, the yield curve slopes up. During a recession, the yield curve typically slopes downward, because inflation and consequently short-term interest rates are currently high, yet people expect inflation and interest rates to fall as the economy comes out of the recession. V. An upward sloping yield curve is indicative of a period where inflation is not expected to trend either up or down, but since the MRP increases with years, the yield curve slopes up. During a recession, the yield curve typically slopes up steeply, because inflation and consequently short-term interest rates are currently high, yet people expect inflation and interest rates to fall as the economy comes out of the recession. -Select- e. If investors in early 1981 expected the inflation rate for every future year to be 10% (i.e., It=1t+1=10% for t=1 to co), what would the yield curve have looked like? Consider all the factors that are likely to affect the curve. Does your answer here make you question the yield curve you drew in part c? I. If inflation rates are expected to be constant, then the expectations theory holds that the yield curve should be horizontal. However, in this event it is likely that maturity risk premiums would be applied to long-term bonds because of the greater risks of holding long-term rather than short-term bonds. Therefore, the yield curve would be more nearly normal; that is, the long-term end of the curve would be raised. II. If inflation rates are expected to be constant, then the expectations theory holds that the yield curve should be vertical. However, in this event it is likely that maturity risk premiums would be applied to long-term bonds because of the greater risks of holding long-term rather than short-term bonds. Therefore, the yield curve would be more nearly normal; that is, the long-term end of the curve would be sloped to the right. III. If inflation rates are expected to be constant, then the expectations theory holds that the yield curve should be horizontal. However, in this event it is likely that maturity risk premiums would be applied to long-term bonds because of the lower risks of holding long-term rather than short-term bonds. Therefore, the yield curve would be more nearly normal; that is, the long-term end of the curve would be raised. IV. If inflation rates are expected to be constant, then the expectations theory holds that the yield curve should be upward sloping. However, in this event it is likely that maturity risk premiums would not be applied to long-term bonds because of the lower risks of holding long-term rather than short-term bonds. Therefore, the yield curve would be more nearly normal; that is, the long-term end of the curve would be horizontal. -Select