Please read through the financial statement and analyze the liquidity. 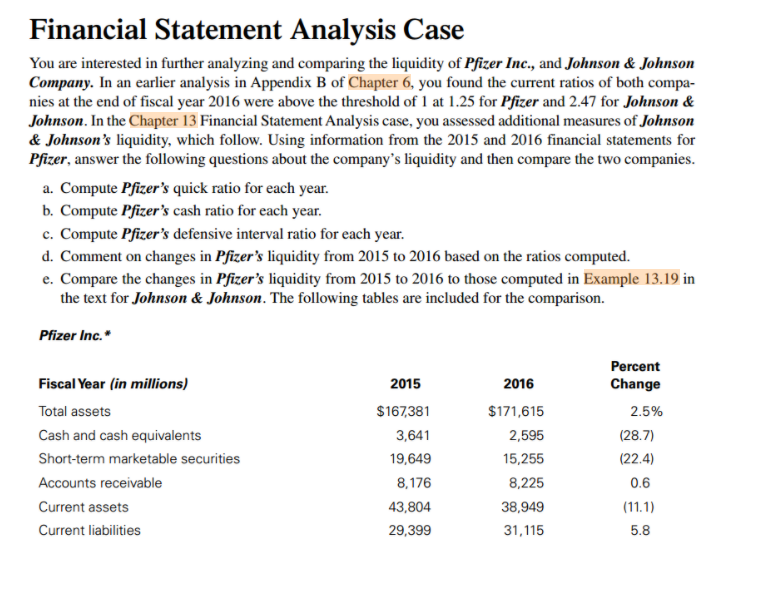
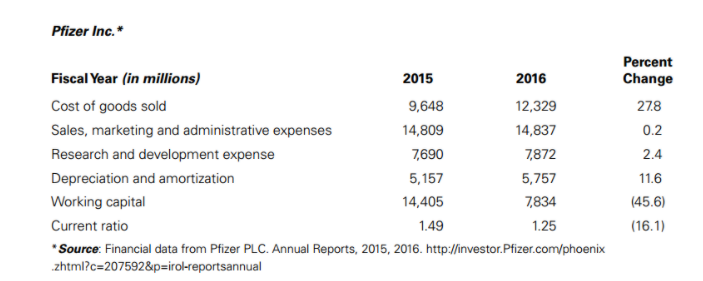
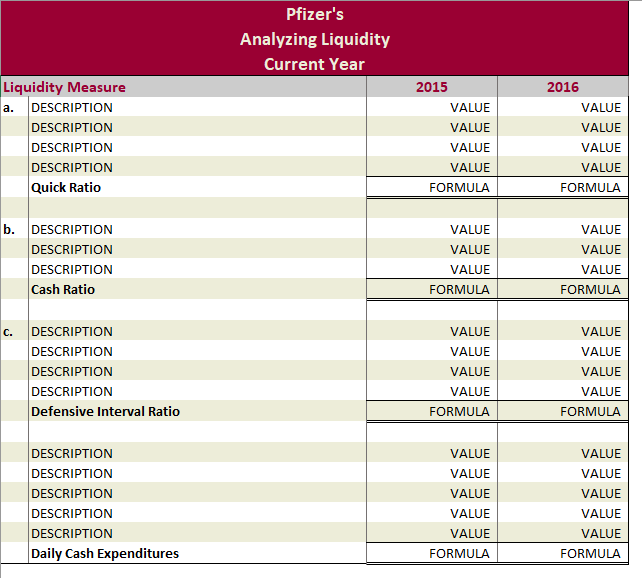
Financial Statement Analysis Case You are interested in further analyzing and comparing the liquidity of Pfizer Inc., and Johnson & Johnson Company. In an earlier analysis in Appendix B of Chapter 6, you found the current ratios of both compa- nies at the end of fiscal year 2016 were above the threshold of 1 at 1.25 for Pfizer and 2.47 for Johnson & Johnson. In the Chapter 13 Financial Statement Analysis case, you assessed additional measures of Johnson & Johnson's liquidity, which follow. Using information from the 2015 and 2016 financial statements for Pfizer, answer the following questions about the company's liquidity and then compare the two companies. a. Compute Pfizer's quick ratio for each year. b. Compute Pfizer's cash ratio for each year. c. Compute Pfizer's defensive interval ratio for each year. d. Comment on changes in Pfizer's liquidity from 2015 to 2016 based on the ratios computed. e. Compare the changes in Pfizer's liquidity from 2015 to 2016 to those computed in Example 13.19 in the text for Johnson & Johnson. The following tables are included for the comparison. Pfizer Inc.* Percent Change 2.5% (28.7) Fiscal Year (in millions) Total assets Cash and cash equivalents Short-term marketable securities Accounts receivable Current assets Current liabilities 2015 $167,381 3,641 19,649 8,176 43,804 29,399 2016 $171,615 2,595 15,255 8,225 38,949 31,115 (22.4) 0.6 (11.1) 5.8 Pfizer Inc. * Fiscal Year (in millions) 2015 2016 Cost of goods sold 9,648 12,329 Sales, marketing and administrative expenses 14,809 14,837 Research and development expense 7,690 7,872 Depreciation and amortization 5,157 5,757 Working capital 14,405 7,834 Current ratio 1.49 1.25 Source: Financial data from Pfizer PLC. Annual Reports, 2015, 2016. http://investor.Pfizer.com/phoenix zhtml?c=207592&p=irol-reportsannual Percent Change 27.8 0.2 2.4 11.6 (45.6) (16.1) Pfizer's Analyzing Liquidity Current Year Liquidity Measure a. DESCRIPTION DESCRIPTION DESCRIPTION DESCRIPTION Quick Ratio 2015 VALUE VALUE VALUE VALUE FORMULA 2016 VALUE VALUE VALUE VALUE FORMULA b. DESCRIPTION DESCRIPTION DESCRIPTION Cash Ratio VALUE VALUE VALUE FORMULA VALUE VALUE VALUE FORMULA VALUE VALUE VALUE VALUE c. DESCRIPTION DESCRIPTION DESCRIPTION DESCRIPTION Defensive Interval Ratio VALUE VALUE VALUE VALUE FORMULA FORMULA VALUE VALUE VALUE VALUE VALUE VALUE DESCRIPTION DESCRIPTION DESCRIPTION DESCRIPTION DESCRIPTION Daily Cash Expenditures VALUE VALUE VALUE VALUE FORMULA FORMULA