Answered step by step
Verified Expert Solution
Link Copied!

Question

1 Approved Answer

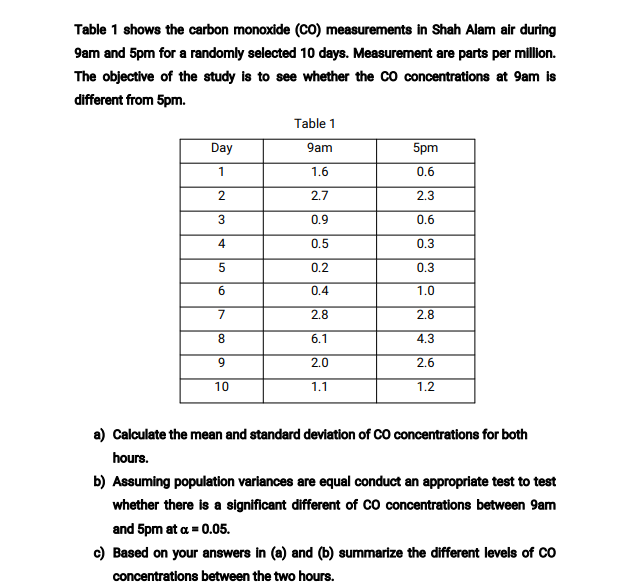
Please refer attached pic Table 1 shows the carbon monoxide (CO) measurements in Shah Alam air during 9am and 5pm for a randomly selected 10

Please refer attached pic

image text in transcribed
Table 1 shows the carbon monoxide (CO) measurements in Shah Alam air during 9am and 5pm for a randomly selected 10 days. Measurement are parts per million. The objective of the study is to see whether the CO concentrations at 9am is different from 5pm. Table 1 Day 9am 5pm 1 1.6 0.6 2 2.7 2.3 3 0.9 0.6 4 0.5 0.3 0.2 0.3 0.4 1.0 2.8 2.8 CO 6.1 4.3 9 2.0 2.6 10 1.1 1.2 a) Calculate the mean and standard deviation of CO concentrations for both hours. b) Assuming population variances are equal conduct an appropriate test to test whether there is a significant different of CO concentrations between 9am and 5pm at a = 0.05. c) Based on your answers in (a) and (b) summarize the different levels of CO concentrations between the two hours

Step by Step Solution

There are 3 Steps involved in it

Step: 1

blur-text-image

Get Instant Access to Expert-Tailored Solutions

See step-by-step solutions with expert insights and AI powered tools for academic success

Step: 2

blur-text-image

Step: 3

blur-text-image

Ace Your Homework with AI

Get the answers you need in no time with our AI-driven, step-by-step assistance

Get Started

Recommended Textbook for

Calculus

Authors: Laura Taalman, Peter Kohn

1st Edition

1464153035, 9781464153037

More Books

Students also viewed these Mathematics questions