Answered step by step
Verified Expert Solution
Link Copied!

Question

1 Approved Answer

Please refer below Figures 2-4 below show the price and quantity decisions made by individual profit-maximising firms of a similar size operating in different markets.

Please refer below
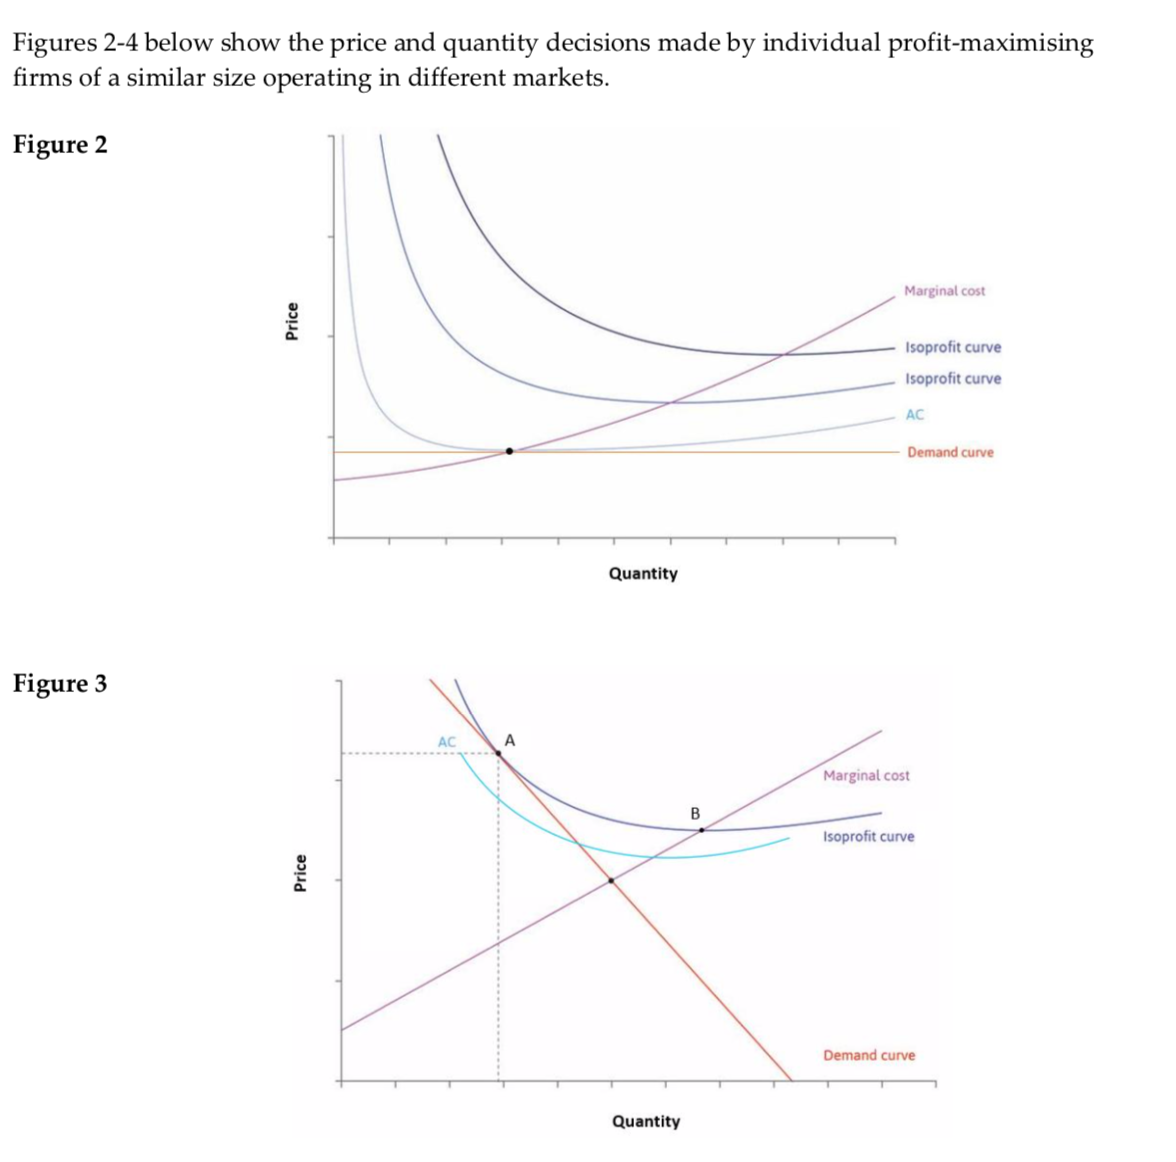
image text in transcribedimage text in transcribedimage text in transcribed
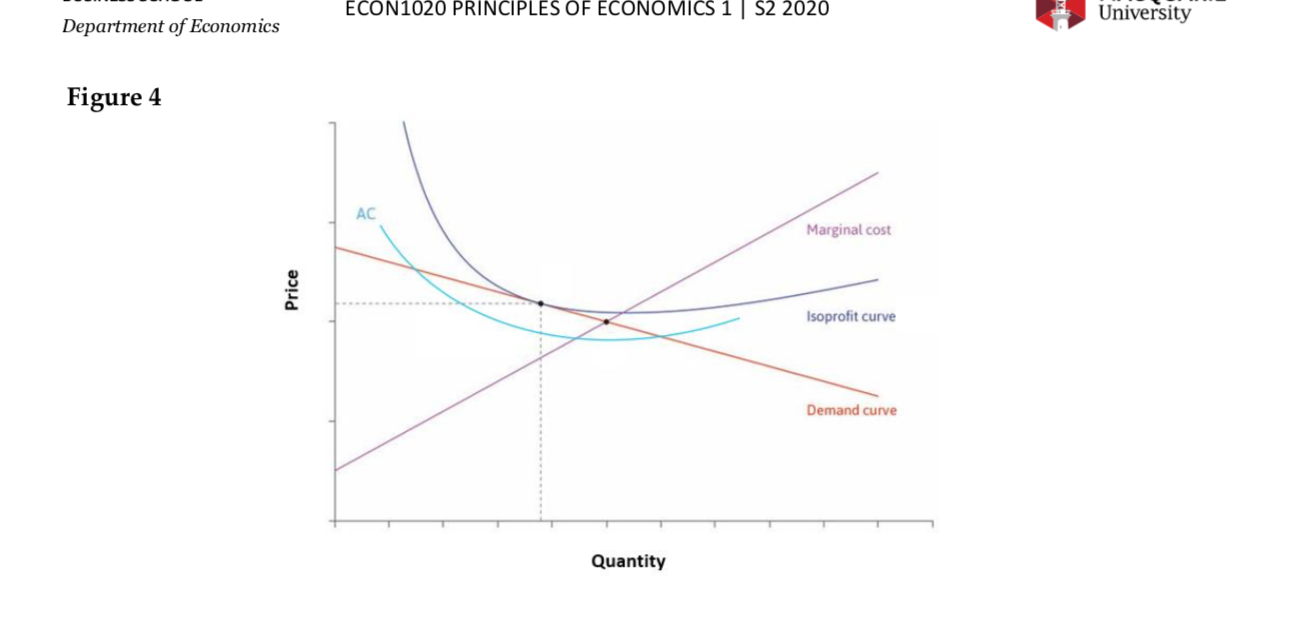
Figures 2-4 below show the price and quantity decisions made by individual profit-maximising firms of a similar size operating in different markets. Figure 2 Price Marginal cost Isoprofit curve Isoprofit curve AC Demand curve Quantity Figure 3 Marginal cost B Isoprofit curve Price Demand curve QuantityU \\ I I. I. U 1 QUESTION 5 [Max 100 words, 2 marks] Consider the market of oranges in Australia. Which gure among Figures 2-4 represents the best the situation of an individual orange farmer? Explain within 100 words. Your answer must refer to the concepts of markup and the price elasticity of demand. (2 marks) Department of Economics ECON1020 PRINCIPLES OF ECONOMICS 1 | S2 2020 University Figure 4 AC Marginal cost Price Isoprofit curve Demand curve Quantity

Step by Step Solution

There are 3 Steps involved in it

Step: 1

blur-text-image

Get Instant Access to Expert-Tailored Solutions

See step-by-step solutions with expert insights and AI powered tools for academic success

Step: 2

blur-text-image

Step: 3

blur-text-image

Ace Your Homework with AI

Get the answers you need in no time with our AI-driven, step-by-step assistance

Get Started

Recommended Textbook for

Macroeconomics Principles Applications And Tools

Authors: Arthur O Sullivan, Steven M. Sheffrin, Stephen J. Perez

7th Edition

978-0134089034, 9780134062754, 134089030, 134062752, 978-0132555234

More Books

Students also viewed these Economics questions