Answered step by step
Verified Expert Solution
Link Copied!

Question

1 Approved Answer

Please refer to the photo: I need help with question 2. Please provide an explanation Table Tools Chapter 11 Homework Written Portion . Word Foxit

Please refer to the photo: I need help with question 2. Please provide an explanation
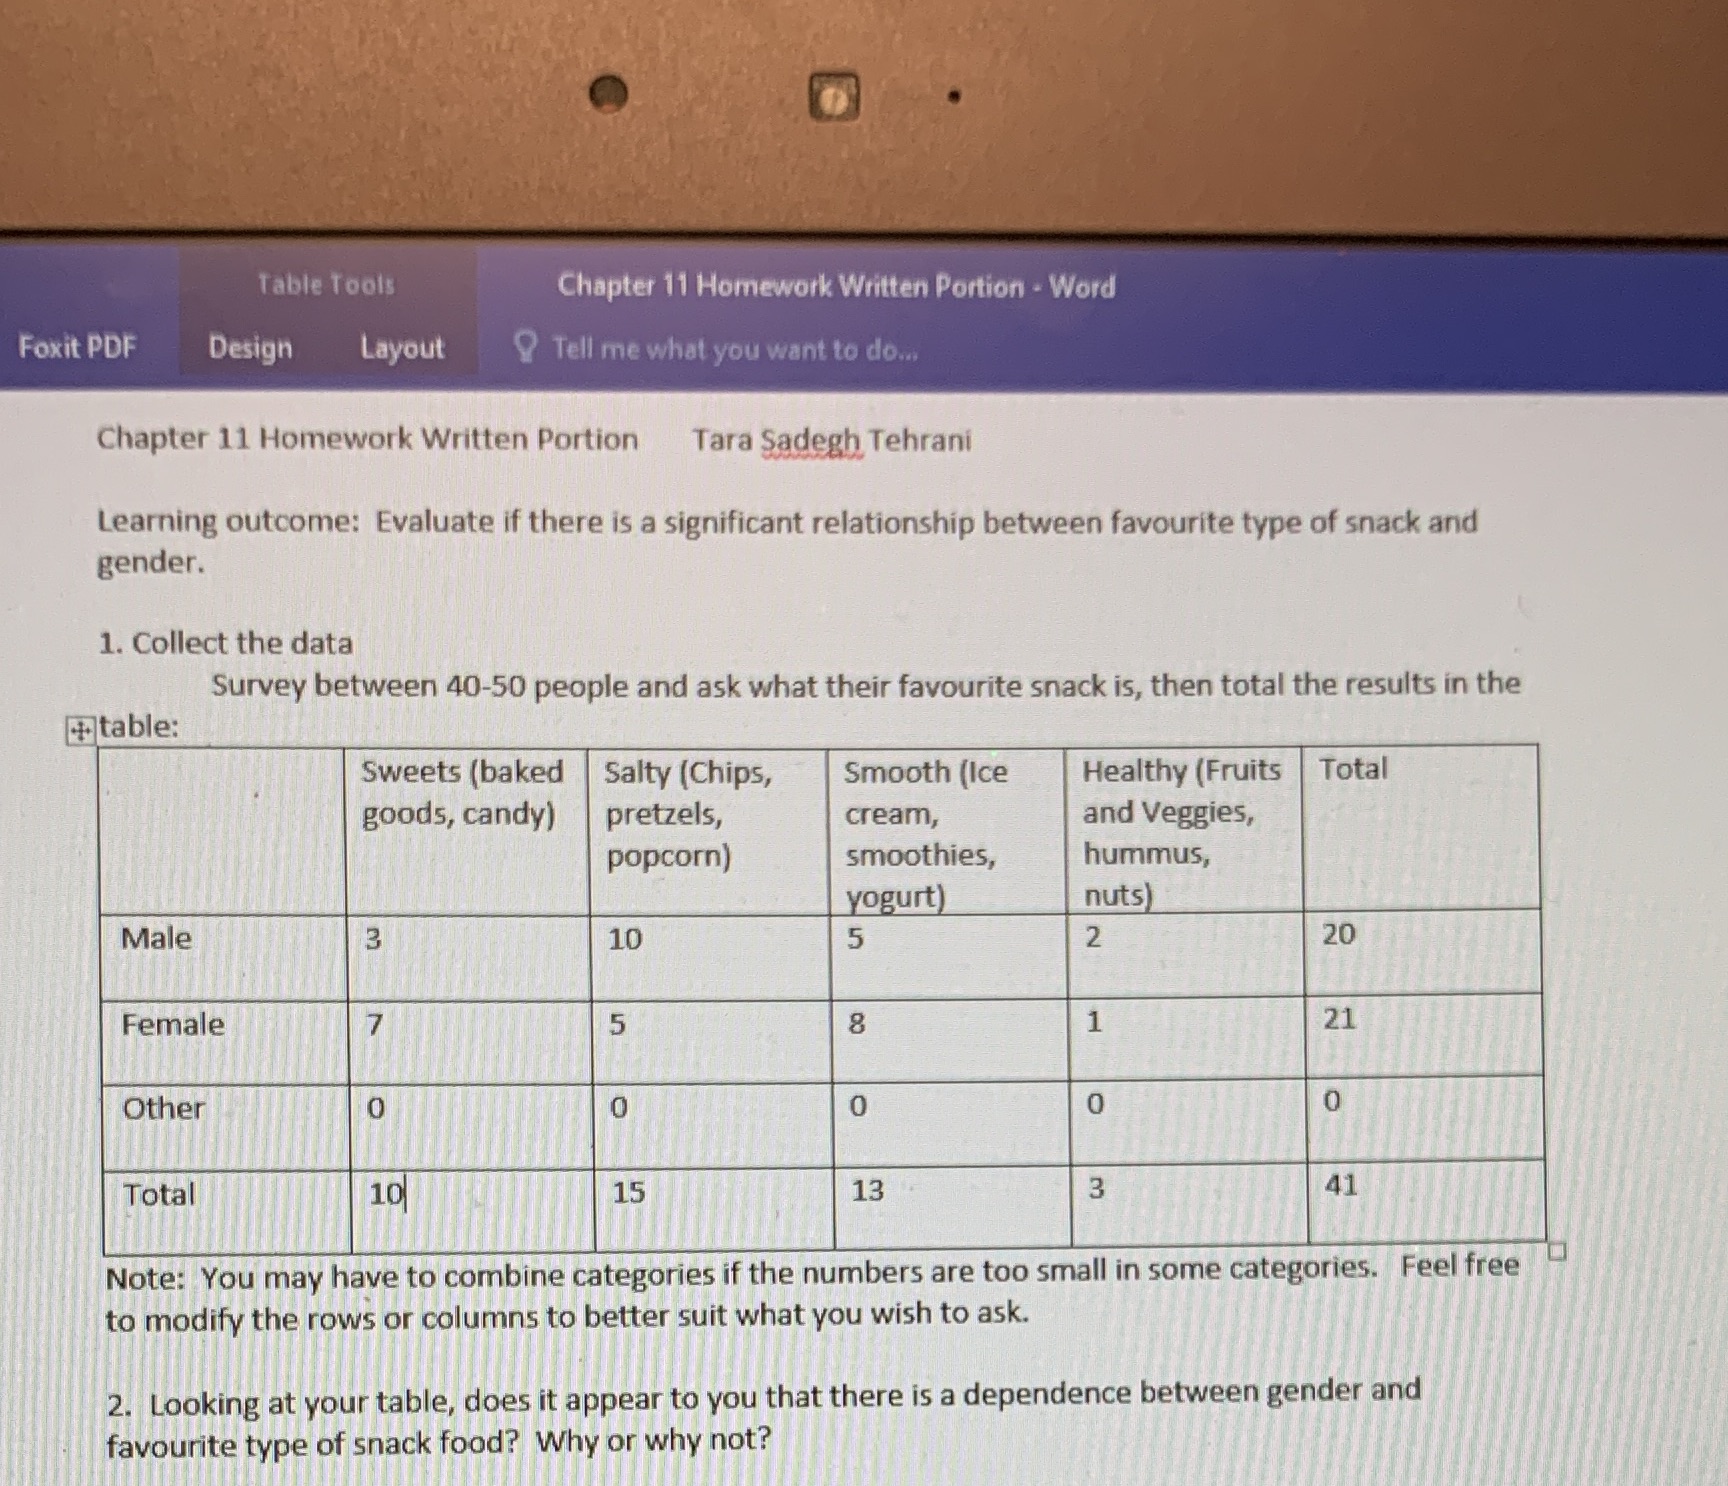
image text in transcribed
Table Tools Chapter 11 Homework Written Portion . Word Foxit PDF Design Layout 9 Tell me what you want to do.. Chapter 11 Homework Written Portion Tara Sadegh Tehrani Learning outcome: Evaluate if there is a significant relationship between favourite type of snack and gender. 1. Collect the data Survey between 40-50 people and ask what their favourite snack is, then total the results in the table: Sweets (baked Salty (Chips, Smooth (Ice Healthy (Fruits | Total goods, candy) pretzels, cream, and Veggies, popcorn) smoothies, hummus, yogurt nuts) Male 3 10 5 2 20 Female 7 5 8 1 21 Other 0 0 0 0 Total 10 15 13 3 41 Note: You may have to combine categories if the numbers are too small in some categories. Feel free to modify the rows or columns to better suit what you wish to ask. 2. Looking at your table, does it appear to you that there is a dependence between gender and favourite type of snack food? Why or why not

Step by Step Solution

There are 3 Steps involved in it

Step: 1

blur-text-image

Get Instant Access to Expert-Tailored Solutions

See step-by-step solutions with expert insights and AI powered tools for academic success

Step: 2

blur-text-image

Step: 3

blur-text-image

Ace Your Homework with AI

Get the answers you need in no time with our AI-driven, step-by-step assistance

Get Started

Recommended Textbook for

Precalculus Enhanced With Graphing Utilities (Subscription)

Authors: Michael, Michael Sullivan III, Michael III Sullivan, III Sullivan

6th Edition

0321849108, 9780321849106

More Books

Students also viewed these Mathematics questions

Question

5. Understand how cultural values influence conflict behavior.

Answered: 1 week ago