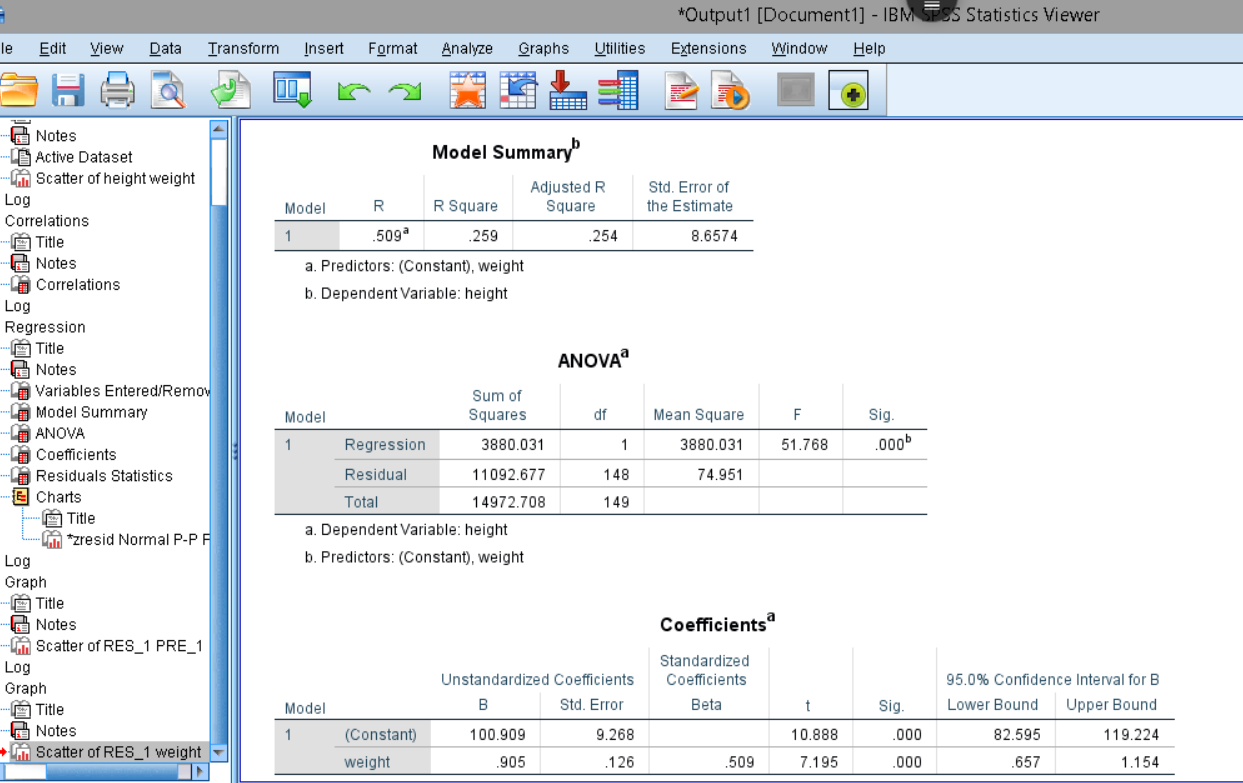
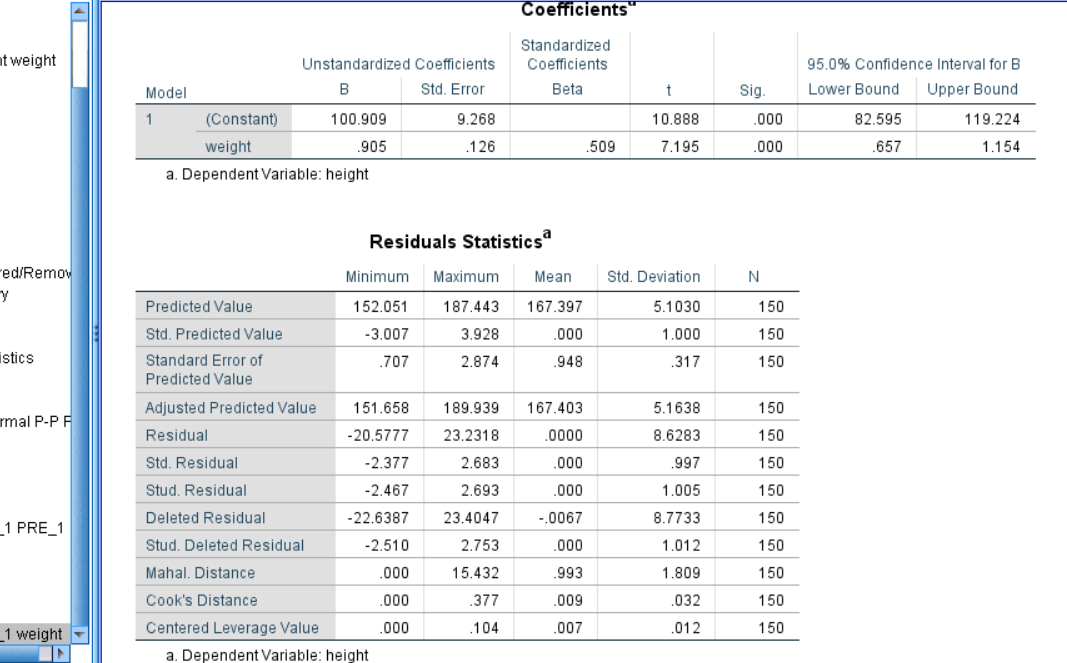
Please review my SPSS output (screenshot #399 and 398) and answer the questions #8 and #9 (screenshot #397).
8. (2 points) Calculate (by hand, showing your work) the residual for the subject (ID=13) with weight of 68.8.+ 38.64 =+ 9. (2 points) Use SPSS to calculate a 95% individual prediction interval for the 68.8 of the subject mentioned in the previous problem (ID=13). Refer to pages 20 and 21 in the SPSS Instruction Manual. Round your final answer to 2 decimal places.+ (152.05, 187.443)+*Output1 [Document1] - IBM SPSS Statistics Viewer le Edit View Data Transform Insert Format Analyze Graphs Utilities Extensions Window Help H Notes Active Dataset Model Summary" [ Scatter of height weight Adjusted R Std. Error of Log Model R R Square Square the Estimate Correlations Title 1 509a 259 .254 8.6574 Notes a. Predictors: (Constant), weight Correlations b. Dependent Variable: height Log Regression Title Notes ANOVA Variables Entered/Remov Sum of Model Summary Model Squares df Mean Square F Sig F ANOVA Regression 3880.031 3880.031 51.768 000 Coefficients Residuals Statistics Residual 11092.677 148 74.951 Charts Total 14972.708 149 Title Can *zresid Normal P-P F a. Dependent Variable: height Log b. Predictors: (Constant), weight Graph Title Notes Coefficients Lin Scatter of RES_1 PRE_1 Log Standardized Unstandardized Coefficients Coefficients 95.0% Confidence Interval for B Graph Title Model B Std. Error Beta Sig Lower Bound Upper Bound Notes 1 (Constant) 100.909 9.268 10.888 000 82.595 119.224 Scatter of RES_1 weight weight 905 126 509 7.195 000 657 1.154Coefficients Standardized it weight Unstandardized Coefficients Coefficients 95.0% Confidence Interval for B Model B Std. Error Beta t Sig. Lower Bound Upper Bound 1 (Constant) 100.909 9.268 10.888 000 82.595 119.224 weight 905 .126 .509 7.195 .000 657 1.154 a. Dependent Variable: height Residuals Statistics ed/Remov Minimum Maximum Mean Std. Deviation N y Predicted Value 152.051 187.443 167.397 5.1030 150 Std. Predicted Value -3.007 3.928 000 1.000 150 stics Standard Error of .707 2.874 .948 317 150 Predicted Value Adjusted Predicted Value 151.658 189.939 167.403 5.1638 150 mal P-P F Residual -20.5777 23.2318 0000 8.6283 150 Std. Residual -2.377 2.683 000 997 150 Stud. Residual -2.467 2.693 000 1.005 150 1 PRE_1 Deleted Residual -22.6387 23.4047 -.0067 8.7733 150 Stud. Deleted Residual -2.510 2.753 000 1.012 150 Mahal. Distance 000 15.432 993 1.809 150 Cook's Distance 000 .377 009 032 150 1 weight Centered Leverage Value 000 104 007 012 150 a. Dependent Variable: height


