

Question
Please see DATA below. What were the pertinent findings of your analysis? How did you arrive at your decisions, and how did you use this
Please see DATA below.
What were the pertinent findings of your analysis? How did you arrive at your decisions, and how did you use this information to calculate working capital for the company?
What recommendations would you make to improve the situation for the company? Briefly describe your recommendations.
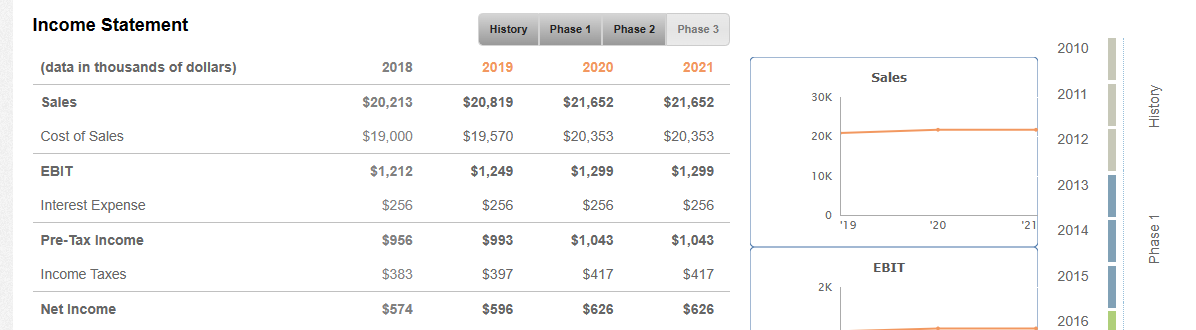
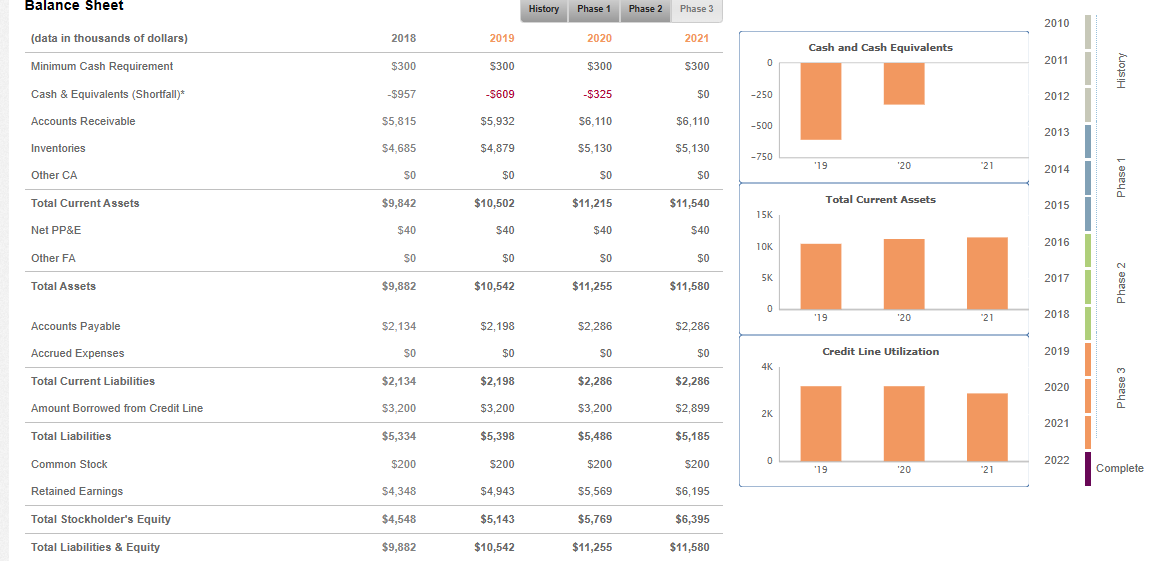
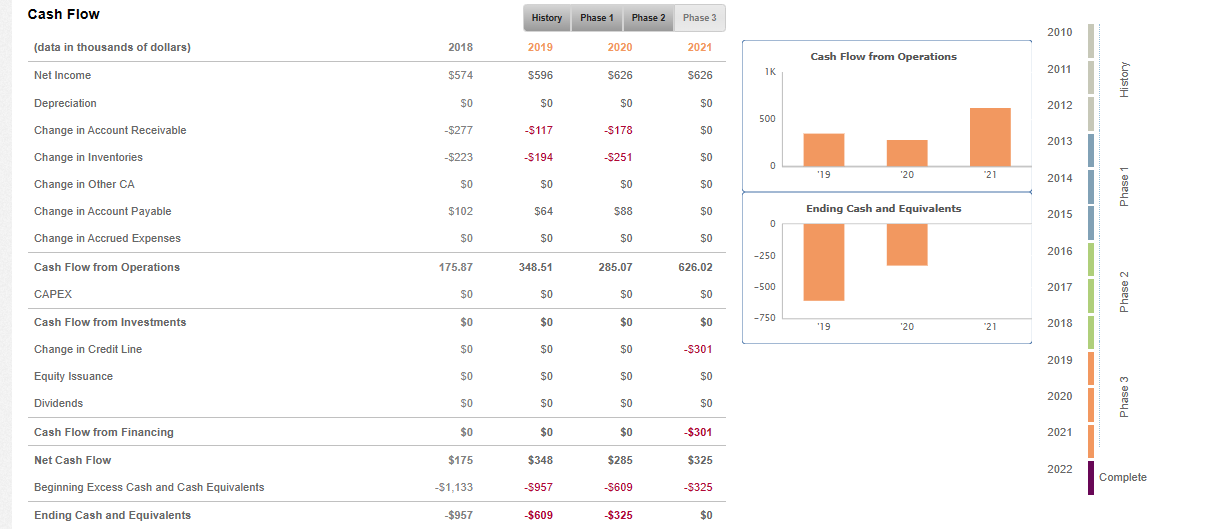 \begin{tabular}{lrrrrr} Income Statement & & History & Phase 1 & Phase 2 & Phase 3 \\ (data in thousands of dollars) & 2018 & 2019 & 2020 & 2021 \\ \hline Sales & $20,213 & $20,819 & $21,652 & $21,652 \\ Cost of Sales & $19,000 & $19,570 & $20,353 & $20,353 \\ \hline EBIT & $1,212 & $1,249 & $1,299 & $1,299 \\ Interest Expense & $256 & $256 & $256 & $256 \\ \hline Pre-Tax Income & $956 & $993 & $1,043 & $1,043 \\ Income Taxes & $383 & $397 & $417 & $417 \\ \hline Net Income & $574 & $596 & $626 & $626 \end{tabular} \begin{tabular}{|c|c|c|c|c|} \hline Balance Sheet & & & History Phase 1 & Phase 2 Phase 3 \\ \hline (data in thousands of dollars) & 2018 & 2019 & 2020 & 2021 \\ \hline Minimum Cash Requirement & $300 & $300 & $300 & $300 \\ \hline Cash \& Equivalents (Shortfall) & $957 & $609 & $325 & $0 \\ \hline Accounts Receivable & $5,815 & $5,932 & $6,110 & $6,110 \\ \hline Inventories & $4,685 & $4,879 & $5,130 & $5,130 \\ \hline Other CA & so & $0 & so & $0 \\ \hline Total Current Assets & $9,842 & $10,502 & $11,215 & $11,540 \\ \hline Net PP\&E & $40 & $40 & $40 & $40 \\ \hline Other FA & so & $0 & so & $0 \\ \hline Total Assets & $9,882 & $10,542 & $11,255 & $11,580 \\ \hline Accounts Payable & $2,134 & $2,198 & $2,286 & $2,286 \\ \hline Accrued Expenses & so & $0 & so & $0 \\ \hline Total Current Liabilities & $2,134 & $2,198 & $2,286 & $2,286 \\ \hline Amount Borrowed from Credit Line & $3,200 & $3,200 & $3,200 & $2,899 \\ \hline Total Liabilities & $5,334 & $5,398 & $5,486 & $5,185 \\ \hline Common Stock & $200 & $200 & $200 & $200 \\ \hline Retained Earnings & $4,348 & $4,943 & $5,569 & $6,195 \\ \hline Total Stockholder's Equity & $4,548 & $5,143 & $5,769 & $6,395 \\ \hline Total Liabilities \& Equity & $9,882 & $10,542 & $11,255 & $11,580 \\ \hline \end{tabular} \begin{tabular}{|c|c|c|c|c|} \hline \multicolumn{2}{|l|}{ Cash Flow } & History & \begin{tabular}{l|l} Phase 1 & Phase 2 \end{tabular} & Phase 3 \\ \hline (data in thousands of dollars) & 2018 & 2019 & 2020 & 2021 \\ \hline Net Income & $574 & $596 & $626 & $626 \\ \hline Depreciation & $0 & $0 & $0 & $0 \\ \hline Change in Account Receivable & $277 & $117 & $178 & $0 \\ \hline Change in Inventories & $223 & $194 & $251 & $0 \\ \hline Change in Other CA & $0 & $0 & $0 & $0 \\ \hline Change in Account Payable & $102 & $64 & $88 & $0 \\ \hline Change in Accrued Expenses & $0 & $0 & $0 & $0 \\ \hline Cash Flow from Operations & 175.87 & 348.51 & 285.07 & 626.02 \\ \hline CAPEX & $0 & $0 & $0 & $0 \\ \hline Cash Flow from Investments & $0 & $0 & $0 & $0 \\ \hline Change in Credit Line & $0 & $0 & $0 & $301 \\ \hline Equity Issuance & $0 & $0 & $0 & $0 \\ \hline Dividends & $0 & $0 & $0 & $0 \\ \hline Cash Flow from Financing & $0 & $0 & $0 & $301 \\ \hline Net Cash Flow & $175 & $348 & $285 & $325 \\ \hline Beginning Excess Cash and Cash Equivalents & $1,133 & $957 & $609 & $325 \\ \hline Ending Cash and Equivalents & $957 & $609 & $325 & $0 \\ \hline \end{tabular} \begin{tabular}{lrrrrr} Income Statement & & History & Phase 1 & Phase 2 & Phase 3 \\ (data in thousands of dollars) & 2018 & 2019 & 2020 & 2021 \\ \hline Sales & $20,213 & $20,819 & $21,652 & $21,652 \\ Cost of Sales & $19,000 & $19,570 & $20,353 & $20,353 \\ \hline EBIT & $1,212 & $1,249 & $1,299 & $1,299 \\ Interest Expense & $256 & $256 & $256 & $256 \\ \hline Pre-Tax Income & $956 & $993 & $1,043 & $1,043 \\ Income Taxes & $383 & $397 & $417 & $417 \\ \hline Net Income & $574 & $596 & $626 & $626 \end{tabular} \begin{tabular}{|c|c|c|c|c|} \hline Balance Sheet & & & History Phase 1 & Phase 2 Phase 3 \\ \hline (data in thousands of dollars) & 2018 & 2019 & 2020 & 2021 \\ \hline Minimum Cash Requirement & $300 & $300 & $300 & $300 \\ \hline Cash \& Equivalents (Shortfall) & $957 & $609 & $325 & $0 \\ \hline Accounts Receivable & $5,815 & $5,932 & $6,110 & $6,110 \\ \hline Inventories & $4,685 & $4,879 & $5,130 & $5,130 \\ \hline Other CA & so & $0 & so & $0 \\ \hline Total Current Assets & $9,842 & $10,502 & $11,215 & $11,540 \\ \hline Net PP\&E & $40 & $40 & $40 & $40 \\ \hline Other FA & so & $0 & so & $0 \\ \hline Total Assets & $9,882 & $10,542 & $11,255 & $11,580 \\ \hline Accounts Payable & $2,134 & $2,198 & $2,286 & $2,286 \\ \hline Accrued Expenses & so & $0 & so & $0 \\ \hline Total Current Liabilities & $2,134 & $2,198 & $2,286 & $2,286 \\ \hline Amount Borrowed from Credit Line & $3,200 & $3,200 & $3,200 & $2,899 \\ \hline Total Liabilities & $5,334 & $5,398 & $5,486 & $5,185 \\ \hline Common Stock & $200 & $200 & $200 & $200 \\ \hline Retained Earnings & $4,348 & $4,943 & $5,569 & $6,195 \\ \hline Total Stockholder's Equity & $4,548 & $5,143 & $5,769 & $6,395 \\ \hline Total Liabilities \& Equity & $9,882 & $10,542 & $11,255 & $11,580 \\ \hline \end{tabular} \begin{tabular}{|c|c|c|c|c|} \hline \multicolumn{2}{|l|}{ Cash Flow } & History & \begin{tabular}{l|l} Phase 1 & Phase 2 \end{tabular} & Phase 3 \\ \hline (data in thousands of dollars) & 2018 & 2019 & 2020 & 2021 \\ \hline Net Income & $574 & $596 & $626 & $626 \\ \hline Depreciation & $0 & $0 & $0 & $0 \\ \hline Change in Account Receivable & $277 & $117 & $178 & $0 \\ \hline Change in Inventories & $223 & $194 & $251 & $0 \\ \hline Change in Other CA & $0 & $0 & $0 & $0 \\ \hline Change in Account Payable & $102 & $64 & $88 & $0 \\ \hline Change in Accrued Expenses & $0 & $0 & $0 & $0 \\ \hline Cash Flow from Operations & 175.87 & 348.51 & 285.07 & 626.02 \\ \hline CAPEX & $0 & $0 & $0 & $0 \\ \hline Cash Flow from Investments & $0 & $0 & $0 & $0 \\ \hline Change in Credit Line & $0 & $0 & $0 & $301 \\ \hline Equity Issuance & $0 & $0 & $0 & $0 \\ \hline Dividends & $0 & $0 & $0 & $0 \\ \hline Cash Flow from Financing & $0 & $0 & $0 & $301 \\ \hline Net Cash Flow & $175 & $348 & $285 & $325 \\ \hline Beginning Excess Cash and Cash Equivalents & $1,133 & $957 & $609 & $325 \\ \hline Ending Cash and Equivalents & $957 & $609 & $325 & $0 \\ \hline \end{tabular}
 Step by Step Solution
There are 3 Steps involved in it
Step: 1

Get Instant Access to Expert-Tailored Solutions
See step-by-step solutions with expert insights and AI powered tools for academic success
Step: 2

Step: 3
Ace Your Homework with AI
Get the answers you need in no time with our AI-driven, step-by-step assistance
Get Started
Broadcasting Finance In Transition
Authors: Jay G. Blumler, T. J. Nossiter
1st Edition
0195050894, 978-0195050899