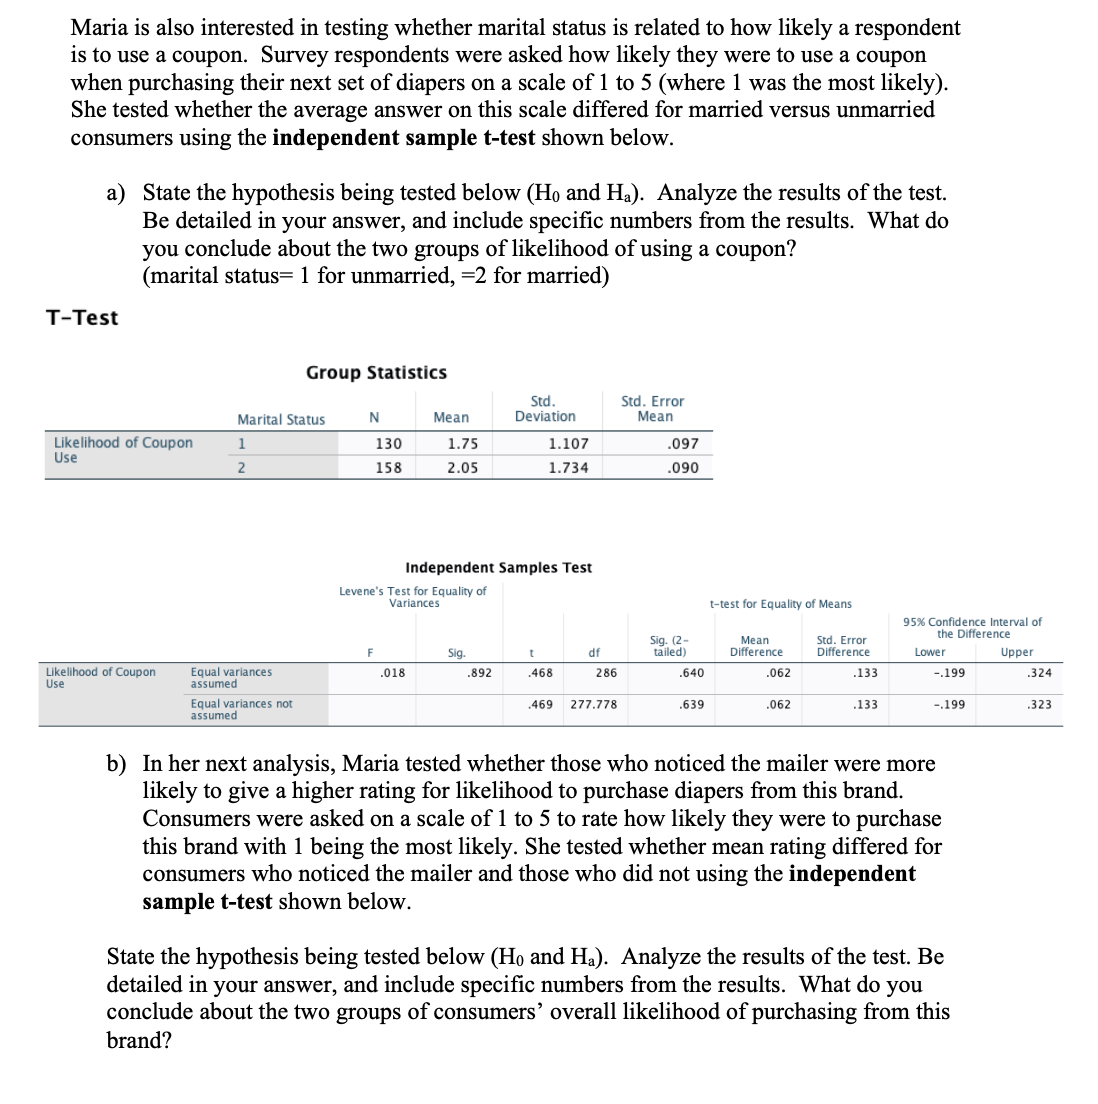
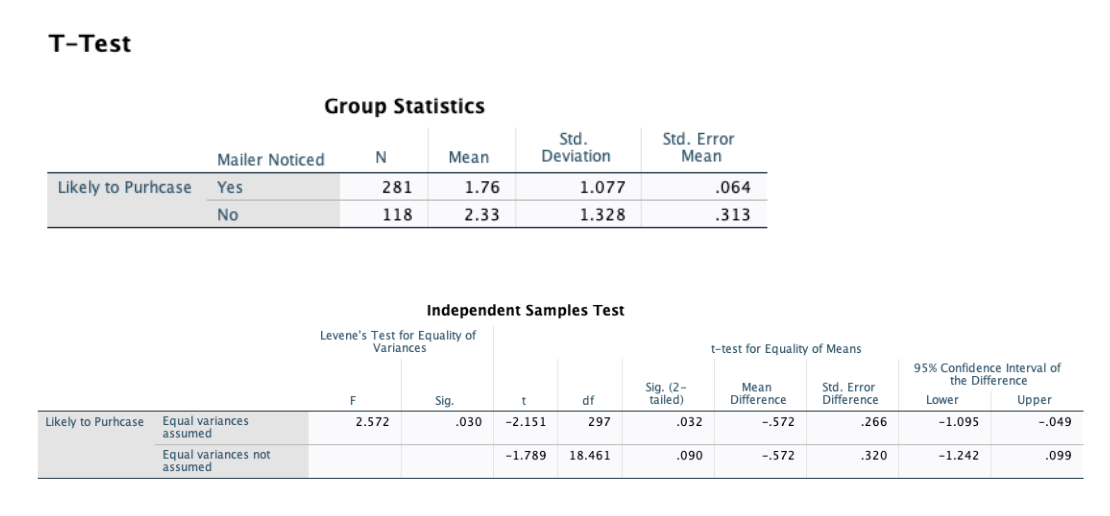
please see the following screenshots (made it easier to read as opposed to trying to copy it piece by piece)
Maria is also interested in testing whether marital status is related to how likely a respondent is to use a coupon. Survey respondents were asked how likely they were to use a coupon when purchasing their next set of diapers on a scale of 1 to 5 (where I was the most likely). She tested whether the average answer on this scale differed for married versus unmarried consumers using the independent sample t-test shown below. a) State the hypothesis being tested below (Ho and Ha). Analyze the results of the test. Be detailed in your answer, and include specific numbers from the results. What do you conclude about the two groups of likelihood of using a coupon? (marital status= 1 for unmarried, =2 for married) T-Test Group Statistics Std. Std. Error Marital Status N Mean Deviation Mean Likelihood of Coupon 1 130 1.75 1.107 097 Use 2 158 2.05 1.734 090 amples Te Levene's Test for Equality o Variances t-test for Equality of Means 95% Confidence Interval of ig. (2- Mean Std. Error the Difference Sig. df tailed) Difference Difference Lower Upper Likelihood of Coupon Equal variances .018 .892 .468 286 .640 .062 .133 -.199 .324 Use assumed Equal variances not .469 277.778 639 .062 .133 -.199 .323 assumed b) In her next analysis, Maria tested whether those who noticed the mailer were more likely to give a higher rating for likelihood to purchase diapers from this brand. Consumers were asked on a scale of 1 to 5 to rate how likely they were to purchase this brand with 1 being the most likely. She tested whether mean rating differed for consumers who noticed the mailer and those who did not using the independent sample t-test shown below. State the hypothesis being tested below (Ho and Ha). Analyze the results of the test. Be detailed in your answer, and include specific numbers from the results. What do you conclude about the two groups of consumers' overall likelihood of purchasing from this brand?T-Test Group Statistics Std. Std. Error Mailer Noticed N Mean Deviation Mean Likely to Purhcase Yes 281 1.76 1.077 .064 No 118 2.33 1.328 .313 Independent Samples Test Levene's Test for Equality of Variances t-test for Equality of Means 95% Confidence Interval of Sig. (2- Mean Std. Error the Difference F Sig. df tailed) Difference Difference Lower Upper Likely to Purhcase Equal variances 2.572 .030 -2.151 297 .032 -.572 .266 -1.095 -.049 assumed Equal variances not -1.789 18.461 090 -.572 .320 -1.242 .099 assumed


