PLEASE SHOW ALL CODE AND USING R STUDIO
ANSWER ALL PARTS THANK YOU
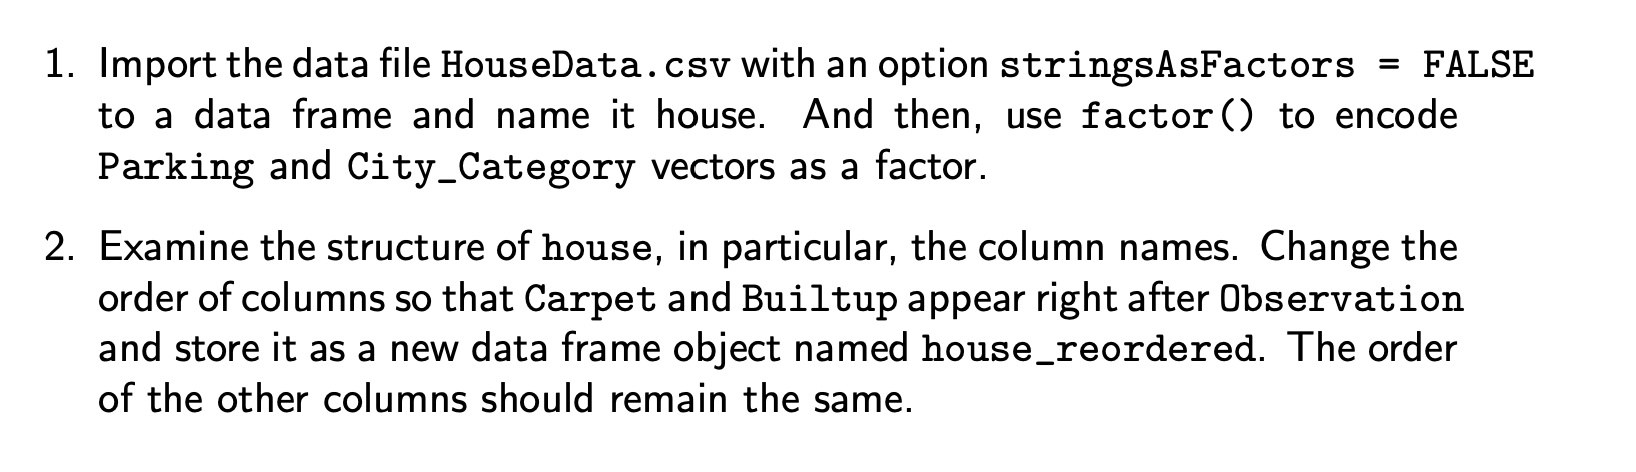
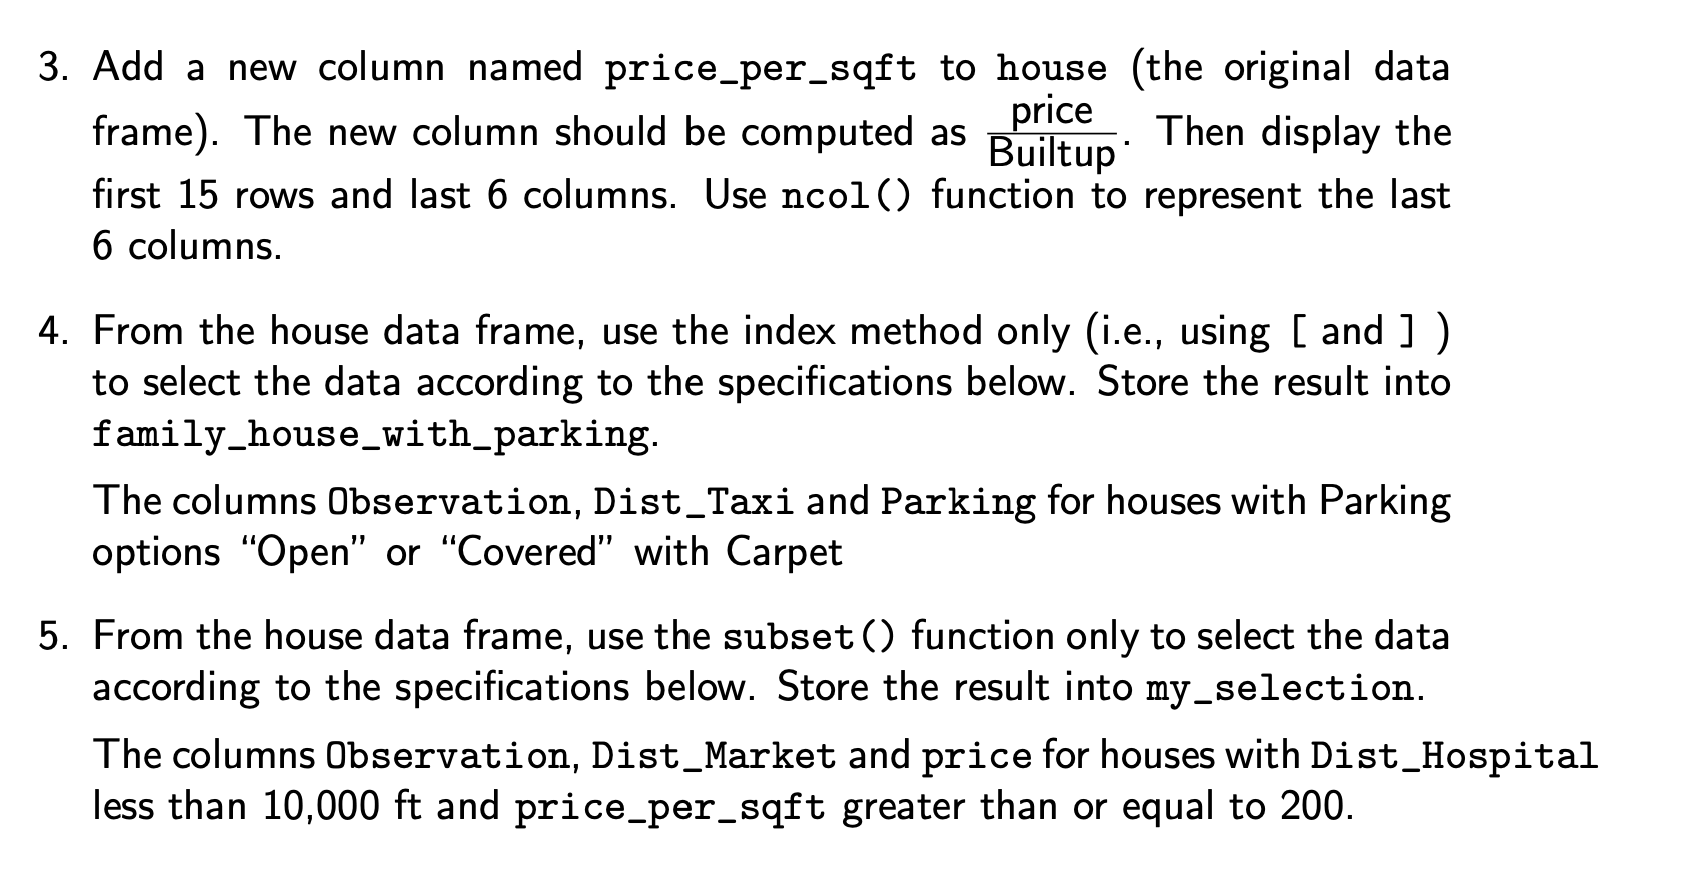
1. Import the data file HouseData.csv with an option stringsAsFactors = FALSE to a data frame and name it house. And then, use factor() to encode Parking and City_Category vectors as a factor. 2. Examine the structure of house, in particular, the column names. Change the order of columns so that Carpet and Builtup appear right after Observation and store it as a new data frame object named house_reordered. The order of the other columns should remain the same. 3. Add a new column named price_per_sqft to house (the original data price frame). The new column should be computed as Builtup Then display the first 15 rows and last 6 columns. Use ncol() function to represent the last 6 columns. 4. From the house data frame, use the index method only (i.e., using [ and ] ) to select the data according to the specifications below. Store the result into family_house_with_parking. The columns Observation, Dist_Taxi and Parking for houses with Parking options "Open" or "Covered" with Carpet 5. From the house data frame, use the subset() function only to select the data according to the specifications below. Store the result into my_selection. The columns Observation, Dist_Market and price for houses with Dist_Hospital less than 10,000 ft and price_per_sqft greater than or equal to 200. 1. Import the data file HouseData.csv with an option stringsAsFactors = FALSE to a data frame and name it house. And then, use factor() to encode Parking and City_Category vectors as a factor. 2. Examine the structure of house, in particular, the column names. Change the order of columns so that Carpet and Builtup appear right after Observation and store it as a new data frame object named house_reordered. The order of the other columns should remain the same. 3. Add a new column named price_per_sqft to house (the original data price frame). The new column should be computed as Builtup Then display the first 15 rows and last 6 columns. Use ncol() function to represent the last 6 columns. 4. From the house data frame, use the index method only (i.e., using [ and ] ) to select the data according to the specifications below. Store the result into family_house_with_parking. The columns Observation, Dist_Taxi and Parking for houses with Parking options "Open" or "Covered" with Carpet 5. From the house data frame, use the subset() function only to select the data according to the specifications below. Store the result into my_selection. The columns Observation, Dist_Market and price for houses with Dist_Hospital less than 10,000 ft and price_per_sqft greater than or equal to 200