Answered step by step
Verified Expert Solution
Link Copied!

Question

1 Approved Answer

please show all steps to solve and how to approach this question Use the following (partial) SPSS output to calculate the correlation coefficient for the

please show all steps to solve and how to approach this question
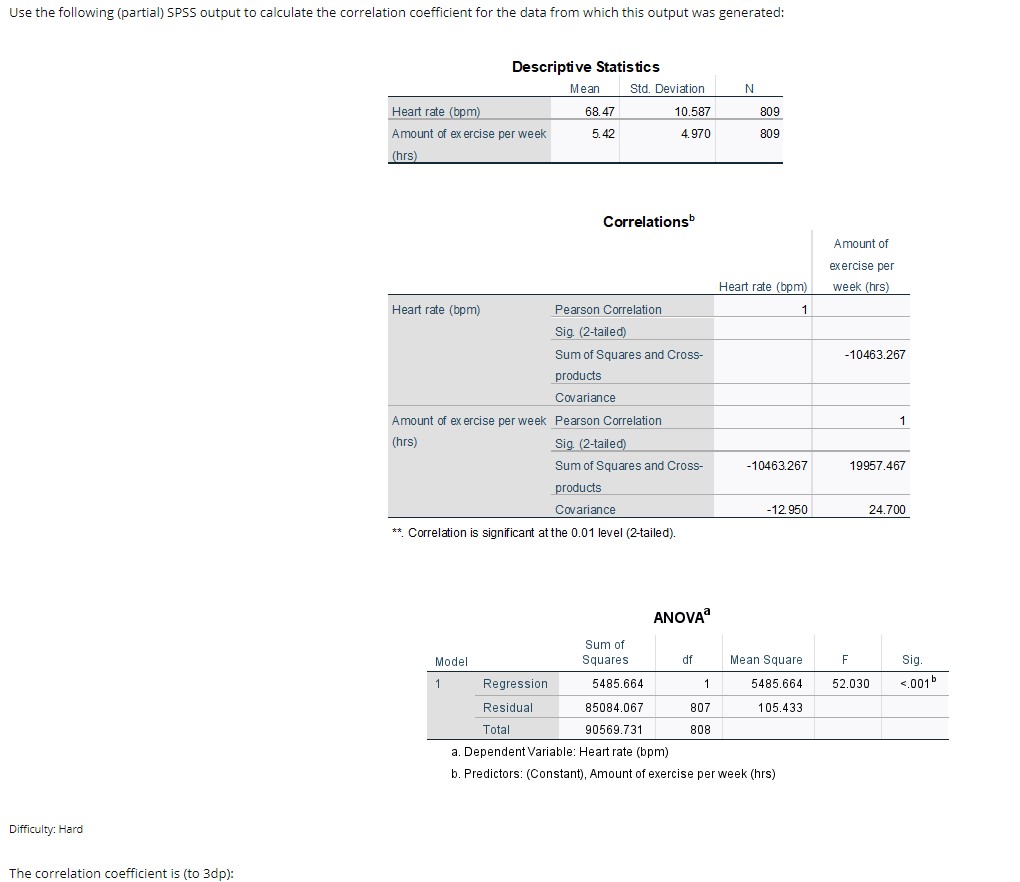
image text in transcribed
Use the following (partial) SPSS output to calculate the correlation coefficient for the data from which this output was generated: Descriptive Statistics Mean Std. Deviation N Heart rate (bpm) 68.47 10.587 809 Amount of ex ercise per week 5.42 4.970 309 (hrs) Correlations Amount of exercise per Heart rate (bpm) week (hrs) Heart rate (bpm) Pearson Correlation Sig. (2-tailed) Sum of Squares and Cross- -10463.267 products Covariance Amount of exercise per week Pearson Correlation (hrs) Sig. (2-tailed) Sum of Squares and Cross- -10463.267 19957.467 products Covariance -12. 950 24.700 ** Correlation is significant at the 0.01 level (2-tailed). ANOVAa Sum of Model Squares df Mean Square F sig. Regression 5485.664 5485.664 2.030 .001 Residual 85084.067 807 105.433 Total 90569.731 808 a. Dependent Variable: Heart rate (bpm) b. Predictors: (Constant), Amount of exercise per week (hrs) Difficulty: Hard The correlation coefficient is (to 3dp)

Step by Step Solution

There are 3 Steps involved in it

Step: 1

blur-text-image

Get Instant Access to Expert-Tailored Solutions

See step-by-step solutions with expert insights and AI powered tools for academic success

Step: 2

blur-text-image

Step: 3

blur-text-image

Ace Your Homework with AI

Get the answers you need in no time with our AI-driven, step-by-step assistance

Get Started

Recommended Textbook for

Advanced Engineering Mathematics

Authors: ERWIN KREYSZIG

9th Edition

0471488852, 978-0471488859

More Books

Students also viewed these Mathematics questions