Answered step by step
Verified Expert Solution
Link Copied!

Question

1 Approved Answer

Please show all work in excel with formulas. Suppose you have been hired as a financial consultant to Raytheon Company (RTN), a large, publicly traded

Please show all work in excel with formulas.

Suppose you have been hired as a financial consultant to Raytheon Company (RTN), a large, publicly traded firm that is the market share leader in radar detection systems (RDSs). The company is looking at setting up a manufacturing plant overseas to produce a new line of RDSs. This will be a five-year project. You need to advise them whether to take the project or not. Calculate the Payback Period, NPV, and IRR for the project and determine whether they should take the project or not.

1. The company bought some land three years ago for $3.7 million in anticipation of using it as a toxic dump site for waste chemicals, but it built a piping system to safely discard the chemicals instead. The land was appraised last week for $4.5 million. 2. In five years, the after tax value of the land will be $4.9 million. 3. The plant and equipment will cost $21 million to build. 4. The manufacturing plant has an eight-year tax life, and RTN uses straight-line depreciation. At the end of the project, the plant and equipment can be scrapped for $3.7 million. 5. The project requires $1,100,000 in initial net working capital investment to get operational. 6. The plan is to manufacture 13,000 RDSs in the first year and sell them at $10,400 per machine. The following 4 years, the number to be produced grows by 15%, 20%, 25%, and 25% annually, i.e. year over year. We will continue to sell them at $10,400 each year. 7. The company will incur $6,000,000 in annual fixed costs, and the variable production costs are $9,000 per RDS in the first year. The following 4 years, variable production costs will grow at a rate of 5%, 3%, 2%, and 2% annually, i.e. year over year. 8. RTNs tax rate is 35 percent. 9. The following market data on RTNs securities is current:

Debt: 222,000, 7.2 percent coupon bonds are outstanding, 25 years to maturity, selling for 108 percent of par; the bonds have a $1,000 par value each and make semiannual payments.

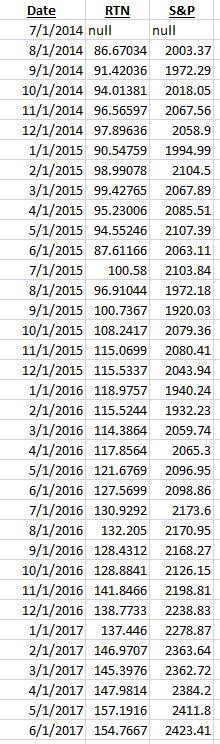
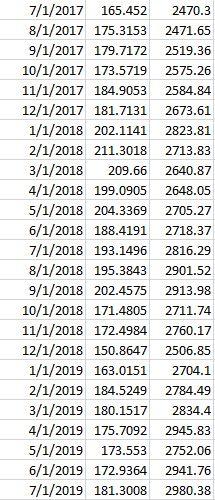
Common: 8,000,000 shares outstanding, selling for $181.30 per share; you have stock prices and S&P 500 index value for the past five years.

Preferred: 442,000 shares of 5 percent preferred stock outstanding, selling for $80.20 per share and having a par value of $100.

Market: 9 percent expected market risk premium; 3 percent risk-free rate.

You will need to estimate RTNs beta using the data in the data file. To do so, you need to convert the prices to returns and then use the Excel slope command.

image text in transcribed

image text in transcribed

Date RIN S&P 7/1/2014 null null 8/1/2014 86.67034 2003.37 9/1/2014 91.42036 1972.29 10/1/2014 94.01381 2018.05 11/1/2014 96.56597 2067.56 12/1/2014 97.89636 2058.9 1/1/2015 90.54759 1994.99 2/1/2015 98.99078 2104.5 3/1/2015 99.42765 2067.89 4/1/2015 95.23006 2085.51 5/1/2015 94.55246 2107.39 6/1/2015 87.61166 2063.11 7/1/2015 100.58 2103.84 8/1/2015 96.91044 1972.18 9/1/2015 100.7367 1920.03 10/1/2015 108.2417 2079.36 11/1/2015 115.0699 2080.41 12/1/2015 115.5337 2043.94 1/1/2016 118.9757 1940.24 2/1/2016 115.5244 1932.23 3/1/2016 114.3864 2059.74 4/1/2016 117.8564 2065.3 5/1/2016 121.6769 2096.95 6/1/2016 127.5699 2098.86 7/1/2016 130.9292 2173.6 8/1/2016 132.205 2170.95 9/1/2016 128.4312 2168.27 10/1/2016 128.8841 2126.15 11/1/2016 141.8466 2198.81 12/1/2016 138.7733 2238.83 1/1/2017 137.446 2278.87 2/1/2017 146.9707 2363.64 3/1/2017 145.3976 2362.72 4/1/2017 147.9814 2384.2 5/1/2017 157.1916 2411.8 6/1/2017 154.7667 2423.41 2470.3 2471.65 2519.36 2575.26 254.4 2673.61 2823.81 2713.83 7/1/2017 165.452 8/1/2017 175.3153 9/1/2017 179.7172 10/1/2017 173.5719 11/1/2017 184.9053 12/1/2017 181.7131 1/1/2018 202.1141 2/1/2018 211,3018 3/1/2018 209.66 4/1/2018 199.0905 5/1/2018 204.3369 6/1/2018 188.4191 7/1/2018 193.1496 8/1/2018 195.3843 9/1/2018 202.4575 10/1/2018 171.4805 11/1/2018 172.4984 12/1/2018 150.8647 1/1/2019 163.0151 12/1/2019 184.5249 3/1/2019 180.1517 4/1/2019 175.7092 5/1/2019 173.553 6/1/2019 172.9364 7/1/2019 181.3008 2640.87 2648.05 2705.27 2718.37 2816.29 2901.52 2913.98 2711.74 2760.17 2506.85 2704.1 2784.49 2834.4 2945.83 2752.06 2941.6 2980.38 Date RIN S&P 7/1/2014 null null 8/1/2014 86.67034 2003.37 9/1/2014 91.42036 1972.29 10/1/2014 94.01381 2018.05 11/1/2014 96.56597 2067.56 12/1/2014 97.89636 2058.9 1/1/2015 90.54759 1994.99 2/1/2015 98.99078 2104.5 3/1/2015 99.42765 2067.89 4/1/2015 95.23006 2085.51 5/1/2015 94.55246 2107.39 6/1/2015 87.61166 2063.11 7/1/2015 100.58 2103.84 8/1/2015 96.91044 1972.18 9/1/2015 100.7367 1920.03 10/1/2015 108.2417 2079.36 11/1/2015 115.0699 2080.41 12/1/2015 115.5337 2043.94 1/1/2016 118.9757 1940.24 2/1/2016 115.5244 1932.23 3/1/2016 114.3864 2059.74 4/1/2016 117.8564 2065.3 5/1/2016 121.6769 2096.95 6/1/2016 127.5699 2098.86 7/1/2016 130.9292 2173.6 8/1/2016 132.205 2170.95 9/1/2016 128.4312 2168.27 10/1/2016 128.8841 2126.15 11/1/2016 141.8466 2198.81 12/1/2016 138.7733 2238.83 1/1/2017 137.446 2278.87 2/1/2017 146.9707 2363.64 3/1/2017 145.3976 2362.72 4/1/2017 147.9814 2384.2 5/1/2017 157.1916 2411.8 6/1/2017 154.7667 2423.41 2470.3 2471.65 2519.36 2575.26 254.4 2673.61 2823.81 2713.83 7/1/2017 165.452 8/1/2017 175.3153 9/1/2017 179.7172 10/1/2017 173.5719 11/1/2017 184.9053 12/1/2017 181.7131 1/1/2018 202.1141 2/1/2018 211,3018 3/1/2018 209.66 4/1/2018 199.0905 5/1/2018 204.3369 6/1/2018 188.4191 7/1/2018 193.1496 8/1/2018 195.3843 9/1/2018 202.4575 10/1/2018 171.4805 11/1/2018 172.4984 12/1/2018 150.8647 1/1/2019 163.0151 12/1/2019 184.5249 3/1/2019 180.1517 4/1/2019 175.7092 5/1/2019 173.553 6/1/2019 172.9364 7/1/2019 181.3008 2640.87 2648.05 2705.27 2718.37 2816.29 2901.52 2913.98 2711.74 2760.17 2506.85 2704.1 2784.49 2834.4 2945.83 2752.06 2941.6 2980.38

Step by Step Solution

There are 3 Steps involved in it

Step: 1

blur-text-image

Get Instant Access to Expert-Tailored Solutions

See step-by-step solutions with expert insights and AI powered tools for academic success

Step: 2

blur-text-image

Step: 3

blur-text-image

Ace Your Homework with AI

Get the answers you need in no time with our AI-driven, step-by-step assistance

Get Started

Recommended Textbook for

Modern Financial Markets Prices, Yields, And Risk Analysis

Authors: Mark Griffiths, Drew Winters, David W Blackwell

1st Edition

0470000104, 9780470000106

More Books

Students also viewed these Finance questions

Question

What were the processes that caused the outcomes?

Answered: 1 week ago