

Answered step by step
Verified Expert Solution
Question
1 Approved Answer
Please show cell references/formulas. Thank you. Suppose that in January 2006, Kenneth Cole Productions had EPS of $1.65 and a book value of equity of
Please show cell references/formulas. Thank you.
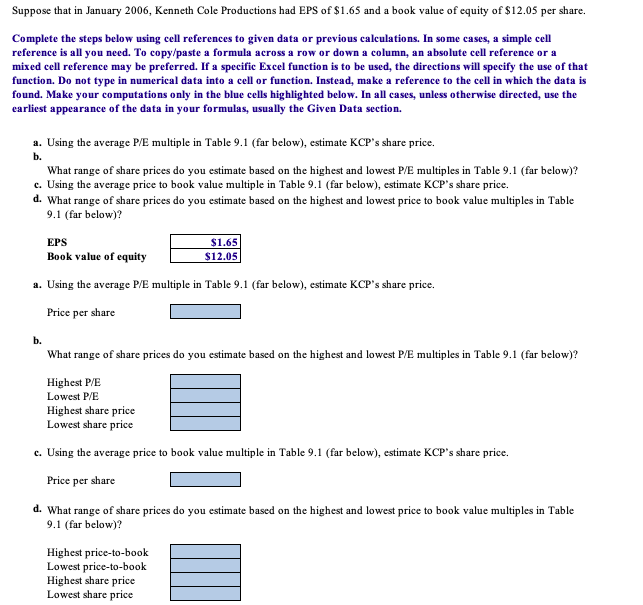
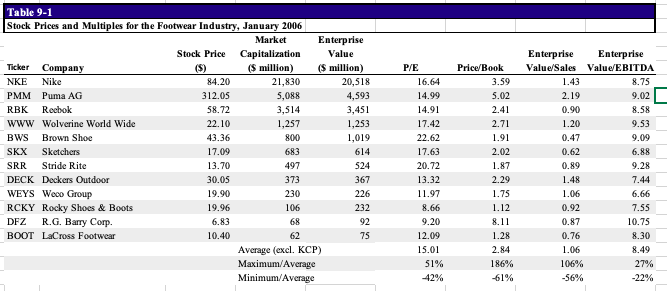
Suppose that in January 2006, Kenneth Cole Productions had EPS of $1.65 and a book value of equity of $12.05 per share. Complete the steps below using cell references to given data or previous calculations. In some cases, a simple cell reference is all you need. To copy/paste a formula across a row or down a column, an absolute cell reference or a mixed cell reference may be preferred. If a specific Excel function is to be used, the directions will specify the use of that function. Do not type in numerical data into a cell or function. Instead, make a reference to the cell in which the data is found. Make your computations only in the blue cells highlighted below. In all cases, unless otherwise directed, use the earliest appearance of the data in your formulas, usually the Given Data section. a. Using the average P/E multiple in Table 9.1 (far below), estimate KCP's share price. b. What range of share prices do you estimate based on the highest and lowest P/E multiples in Table 9.1 (far below)? c. Using the average price to book value multiple in Table 9.1 (far below), estimate KCP's share price. d. What range of share prices do you estimate based on the highest and lowest price to book value multiples in Table 9.1 (far below)? EPS $1.65 $12.05 Book value of equity a. Using the average P/E multiple in Table 9.1 (far below), estimate KCP's share price. Price per share b. What range of share prices do you estimate based on the highest and lowest P/E multiples in Table 9.1 (far below)? Highest P/E Lowest P/E Highest share price Lowest share price c. Using the average price to book value multiple in Table 9.1 (far below), estimate KCP's share price. Price per share d. What range of share prices do you estimate based on the highest and lowest price to book value multiples in Table 9.1 (far below)? Highest price-to-book Lowest price-to-book Highest share price Lowest share price Table 9-1 Stock Prices and Multiples for the Footwear Industry, January 2006 Market Capitalization Stock Price ($ million) Ticker Company NKE Nike PMM Puma AG RBK Reebok WWW Wolverine World Wide BWS Brown Shoe SKX Sketchers SRR Stride Rite DECK Deckers Outdoor WEYS Weco Group RCKY Rocky Shoes & Boots DFZ R.G. Barry Corp. BOOT LaCross Footwear 84.20 312.05 58.72 22.10 43.36 17.09 13.70 30.05 19.90 19.96 6.83 10.40 Enterprise Value ($ million) 21,830 5,088 3,514 1,257 800 683 497 373 230 106 68 62 Average (excl. KCP) Maximum/Average Minimum/Average 20,518 4,593 3,451 1,253 1,019 614 524 367 226 232 92 75 P/E 16.64 14.99 14.91 17.42 22.62 17.63 20.72 13.32 11.97 8.66 9.20 12.09 15.01 51% -42% Price/Book 3.59 5.02 2.41 2.71 1.91 2.02 1.87 2.29 1.75 1.12 8.11 1.28 2.84 186% -61% Enterprise Enterprise Value/Sales Value/EBITDA 1.43 8.75 2.19 9.02 0.90 8.58 1.20 9.53 0.47 9.09 0.62 6.88 0.89 9.28 1.48 7.44 1.06 6.66 0.92 7.55 0.87 10.75 0.76 8.30 1.06 8.49 106% -56% 27% -22%Step by Step Solution
There are 3 Steps involved in it
Step: 1

Get Instant Access to Expert-Tailored Solutions
See step-by-step solutions with expert insights and AI powered tools for academic success
Step: 2

Step: 3
Ace Your Homework with AI
Get the answers you need in no time with our AI-driven, step-by-step assistance
Get Started
Risk Sharing Finance
Authors: Bakkali Mirakhor, Saad Abbas
1st Edition
3110590468, 978-3110590463