Answered step by step
Verified Expert Solution
Link Copied!

Question

1 Approved Answer

Please show formula in excel A THREE-ASSET PORTFOLIO PROBLEM begin{tabular}{|l|r|r|r|} hline & Stock A & Stock B & multicolumn{1}{|c|}{ Stock C } hline Mean

Please show formula in excel image text in transcribed
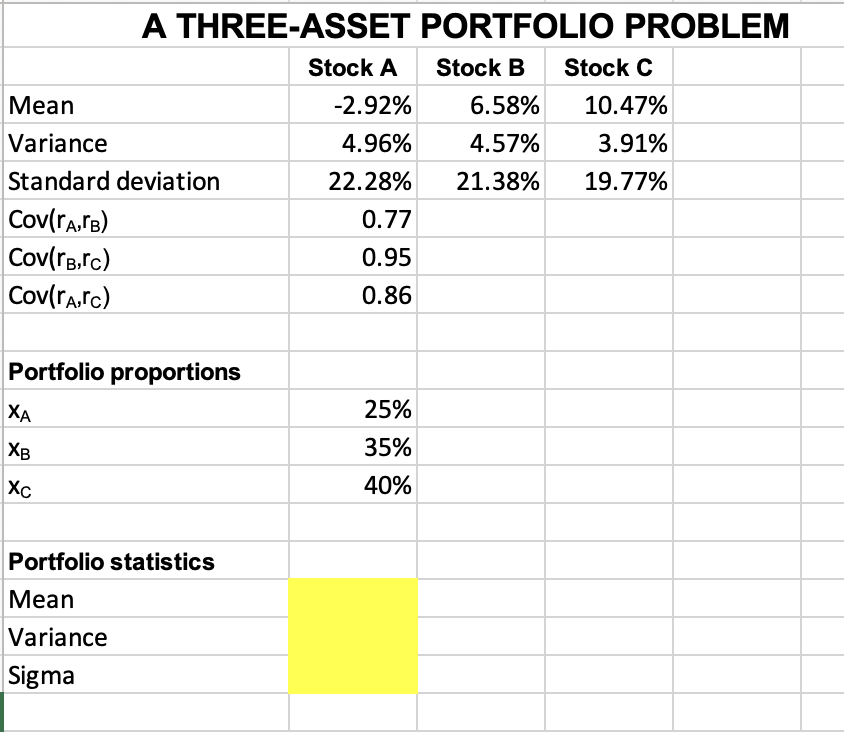
A THREE-ASSET PORTFOLIO PROBLEM \begin{tabular}{|l|r|r|r|} \hline & Stock A & Stock B & \multicolumn{1}{|c|}{ Stock C } \\ \hline Mean & 2.92% & 6.58% & 10.47% \\ \hline Variance & 4.96% & 4.57% & 3.91% \\ \hline Standard deviation & 22.28% & 21.38% & 19.77% \\ \hline Cov(rA,rB) & 0.77 & & \\ \hline Cov(rB,rC) & 0.95 & & \\ \hline Cov(rA,rC) & 0.86 & & \\ \hline \end{tabular} Portfolio proportions \begin{tabular}{|l|l|} \hline XA & 25% \\ \hline xB & 35% \\ \hline xC & 40% \\ \hline \end{tabular} Portfolio statistics Mean Variance Sigma A THREE-ASSET PORTFOLIO PROBLEM \begin{tabular}{|l|r|r|r|} \hline & Stock A & Stock B & \multicolumn{1}{|c|}{ Stock C } \\ \hline Mean & 2.92% & 6.58% & 10.47% \\ \hline Variance & 4.96% & 4.57% & 3.91% \\ \hline Standard deviation & 22.28% & 21.38% & 19.77% \\ \hline Cov(rA,rB) & 0.77 & & \\ \hline Cov(rB,rC) & 0.95 & & \\ \hline Cov(rA,rC) & 0.86 & & \\ \hline \end{tabular} Portfolio proportions \begin{tabular}{|l|l|} \hline XA & 25% \\ \hline xB & 35% \\ \hline xC & 40% \\ \hline \end{tabular} Portfolio statistics Mean Variance Sigma

Step by Step Solution

There are 3 Steps involved in it

Step: 1

blur-text-image

Get Instant Access to Expert-Tailored Solutions

See step-by-step solutions with expert insights and AI powered tools for academic success

Step: 2

blur-text-image_2

Step: 3

blur-text-image_3

Ace Your Homework with AI

Get the answers you need in no time with our AI-driven, step-by-step assistance

Get Started

Recommended Textbook for

Build An Online Retail System For Under $150

Authors: Roger Butterworth

1st Edition

1530170044, 978-1530170043

More Books

Students also viewed these Finance questions