Answered step by step
Verified Expert Solution
Question
1 Approved Answer
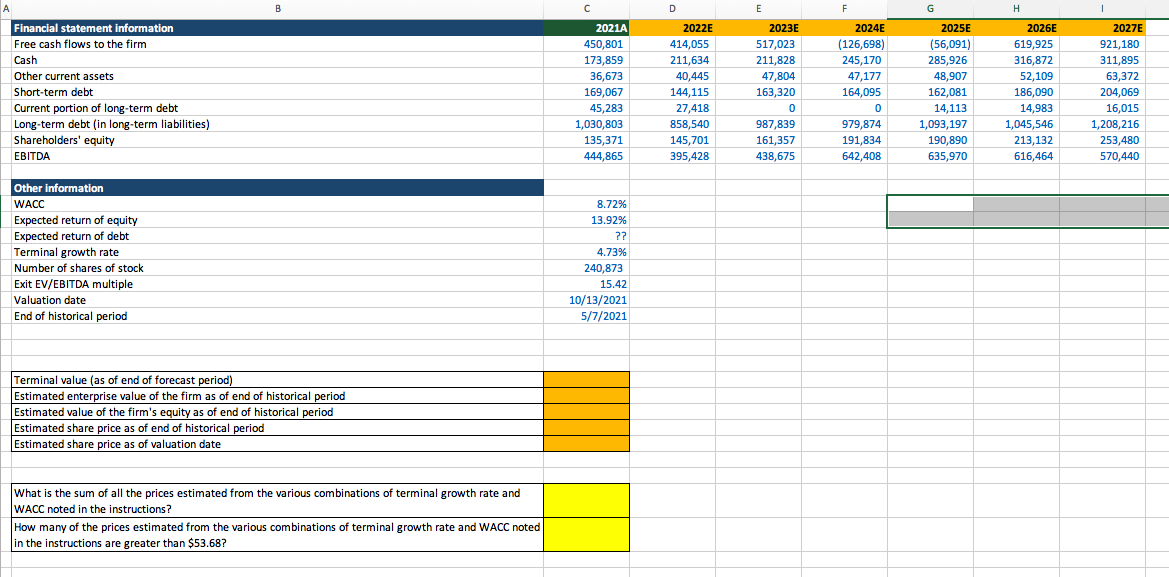
Please show formulas for orange and yellow boxes. Thanks! D E F G . Financial statement information Free cash flows to the firm Cash Other
 Please show formulas for orange and yellow boxes. Thanks!
D E F G . Financial statement information Free cash flows to the firm Cash Other current assets Short-term debt Current portion of long-term debt Long-term debt (in long-term liabilities) Shareholders' equity EBITDA 2021A 450,801 173,859 36,673 169,067 45,283 200 1,030,803 135,371 444,865 2022E 414,055 211,634 40,445 144,115 27,418 858,540 145,701 395,428 2023E 517,023 211,828 47,804 163,320 0 987,839 161,357 438,675 2024E (126,698) 245,170 47,177 164,095 0 979,874 191,834 642,408 2025E (56,091) 285,926 48,907 162,081 14,113 1,093,197 190,890 635,970 2026E 619,925 316,872 52,109 186,090 14,983 1,045,546 213,132 616,464 2027E 921,180 311,895 63,372 204,069 16,015 1,208,216 253,480 570,440 Other information WACC Expected return of equity Expected return of debt Terminal growth rate Number of shares of stock Exit EV/EBITDA multiple Valuation date End of historical period 8.72% 13,92% ?? 4.73% 240,873 15.42 10/13/2021 5/7/2021 Terminal value (as of end of forecast period) Estimated enterprise value of the firm as of end of historical period Estimated value of the firm's equity as of end of historical period Estimated share price as of end of historical period Estimated share price as of valuation date What is the sum of all the prices estimated from the various combinations of terminal growth rate and WACC noted in the instructions? How many of the prices estimated from the various combinations of terminal growth rate and WACC noted in the instructions are greater than $53.68? D E F G . Financial statement information Free cash flows to the firm Cash Other current assets Short-term debt Current portion of long-term debt Long-term debt (in long-term liabilities) Shareholders' equity EBITDA 2021A 450,801 173,859 36,673 169,067 45,283 200 1,030,803 135,371 444,865 2022E 414,055 211,634 40,445 144,115 27,418 858,540 145,701 395,428 2023E 517,023 211,828 47,804 163,320 0 987,839 161,357 438,675 2024E (126,698) 245,170 47,177 164,095 0 979,874 191,834 642,408 2025E (56,091) 285,926 48,907 162,081 14,113 1,093,197 190,890 635,970 2026E 619,925 316,872 52,109 186,090 14,983 1,045,546 213,132 616,464 2027E 921,180 311,895 63,372 204,069 16,015 1,208,216 253,480 570,440 Other information WACC Expected return of equity Expected return of debt Terminal growth rate Number of shares of stock Exit EV/EBITDA multiple Valuation date End of historical period 8.72% 13,92% ?? 4.73% 240,873 15.42 10/13/2021 5/7/2021 Terminal value (as of end of forecast period) Estimated enterprise value of the firm as of end of historical period Estimated value of the firm's equity as of end of historical period Estimated share price as of end of historical period Estimated share price as of valuation date What is the sum of all the prices estimated from the various combinations of terminal growth rate and WACC noted in the instructions? How many of the prices estimated from the various combinations of terminal growth rate and WACC noted in the instructions are greater than $53.68
Step by Step Solution
There are 3 Steps involved in it
Step: 1

Get Instant Access to Expert-Tailored Solutions
See step-by-step solutions with expert insights and AI powered tools for academic success
Step: 2

Step: 3

Ace Your Homework with AI
Get the answers you need in no time with our AI-driven, step-by-step assistance
Get Started


