Please show how the formulas are applied :)
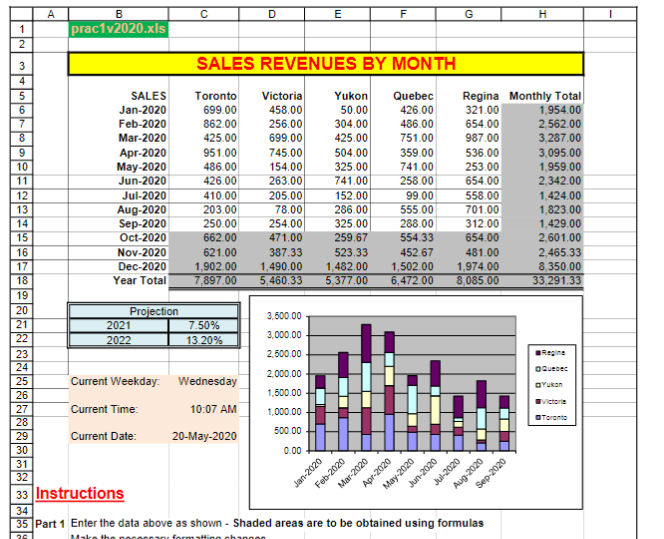
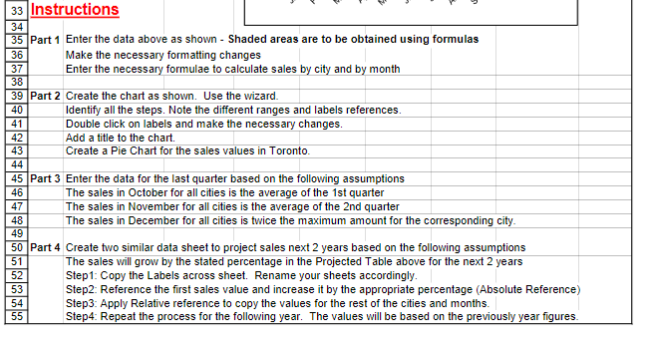
1 Enter the data above as shown - Shaded areas are to be obtained using formulas Make the necessary formatting changes Enter the necessary formulae to calculate sales by city and by month Create the chart as shown. Use the wizard. Identify all the steps. Note the different ranges and labels references. Double click on labels and make the necessary changes. Add a title to the chart. Create a Pie Chart for the sales values in Toronto. 3 Enter the data for the last quarter based on the following assumptions The sales in October for all cities is the average of the 1st quarter The sales in November for all cities is the average of the 2 nd quarter The sales in December for all cities is twice the maximum amount for the corresponding city. 4 Create two similar data sheet to project sales next 2 years based on the following assumptions The sales will grow by the stated percentage in the Projected Table above for the next 2 years Step1: Copy the Labels across sheet. Rename your sheets accordingly. Step2: Reference the first sales value and increase it by the appropriate percentage (Absolute Reference) Step3: Apply Relative reference to copy the values for the rest of the cities and months. Step4: Repeat the process for the following year. The values will be based on the previously year figures. 1 Enter the data above as shown - Shaded areas are to be obtained using formulas Make the necessary formatting changes Enter the necessary formulae to calculate sales by city and by month Create the chart as shown. Use the wizard. Identify all the steps. Note the different ranges and labels references. Double click on labels and make the necessary changes. Add a title to the chart. Create a Pie Chart for the sales values in Toronto. 3 Enter the data for the last quarter based on the following assumptions The sales in October for all cities is the average of the 1st quarter The sales in November for all cities is the average of the 2 nd quarter The sales in December for all cities is twice the maximum amount for the corresponding city. 4 Create two similar data sheet to project sales next 2 years based on the following assumptions The sales will grow by the stated percentage in the Projected Table above for the next 2 years Step1: Copy the Labels across sheet. Rename your sheets accordingly. Step2: Reference the first sales value and increase it by the appropriate percentage (Absolute Reference) Step3: Apply Relative reference to copy the values for the rest of the cities and months. Step4: Repeat the process for the following year. The values will be based on the previously year figures