

Answered step by step
Verified Expert Solution
Question
1 Approved Answer
please show me how to solve this problem QUESTION 3 [9] 3.1 An OLS (least squares) linear regression model was fitted to 50 pairs of
please show me how to solve this problem
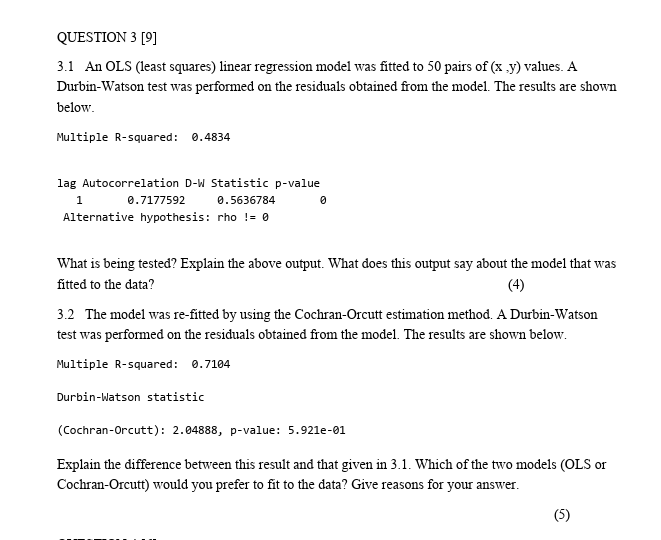
QUESTION 3 [9] 3.1 An OLS (least squares) linear regression model was fitted to 50 pairs of (x,y) values. A Durbin-Watson test was performed on the residuals obtained from the model. The results are shown below. Multiple R-squared: 0.4834 lag Autocorrelation D-W Statistic p-value 1 0.7177592 0.5636784 0 Alternative hypothesis: rho != 0 What is being tested? Explain the above output. What does this output say about the model that was fitted to the data? (4) 3.2 The model was re-fitted by using the Cochran-Orcutt estimation method. A Durbin-Watson test was performed on the residuals obtained from the model. The results are shown below. Multiple R-squared: 0.7104 Durbin-Watson statistic (Cochran-Orcutt): 2.04888, p-value: 5.921e-01 Explain the difference between this result and that given in 3.1. Which of the two models (OLS or Cochran-Orcutt) would you prefer to fit to the data? Give reasons for yourStep by Step Solution
There are 3 Steps involved in it
Step: 1

Get Instant Access to Expert-Tailored Solutions
See step-by-step solutions with expert insights and AI powered tools for academic success
Step: 2

Step: 3
Ace Your Homework with AI
Get the answers you need in no time with our AI-driven, step-by-step assistance
Get Started
Public Sector Accounting And Auditing In Europe The Challenge Of Harmonization
Authors: I. Brusca, E. Caperchione, S. Cohen, F Manes Rossi
2015th Edition
1137461330, 978-1137461339