

Answered step by step
Verified Expert Solution
Question
1 Approved Answer
Please show sample calculations. Thank you. An industrial equipment manufacturer uses the test rig pictured below in order to determine the performance characteristics of a
Please show sample calculations. Thank you. 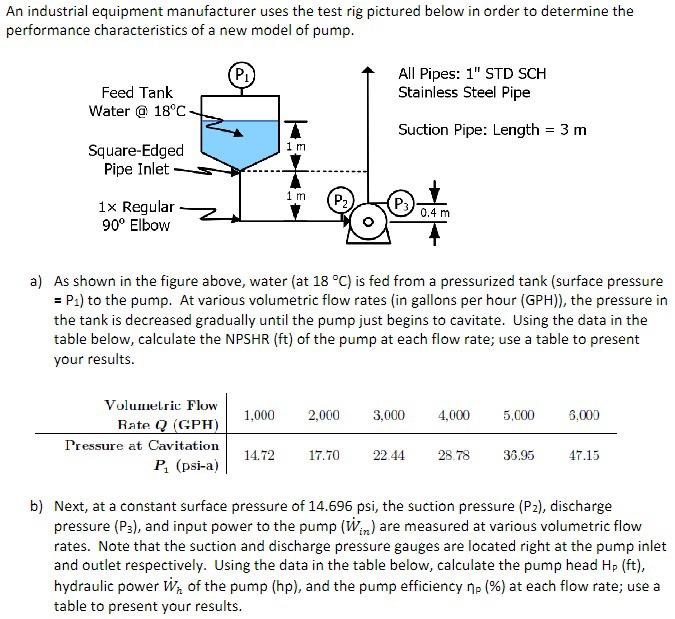
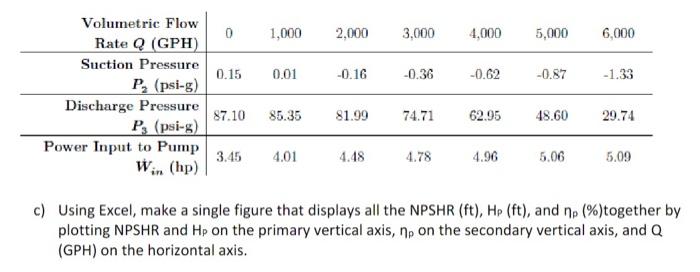
An industrial equipment manufacturer uses the test rig pictured below in order to determine the performance characteristics of a new model of pump. Feed Tank Water @ 18C All Pipes: 1" STD SCH Stainless Steel Pipe 2 im Suction Pipe: Length = 3 m Square-Edged Pipe Inlet 1 m P2) 1x Regular 90 Elbow 0.4 m a) As shown in the figure above, water (at 18 C) is fed from a pressurized tank (surface pressure = P.) to the pump. At various volumetric flow rates (in gallons per hour (GPH)), the pressure in the tank is decreased gradually until the pump just begins to cavitate. Using the data in the table below, calculate the NPSHR (ft) of the pump at each flow rate; use a table to present your results. 1,000 2,000 3,000 4,000 5,000 6.000 Volumetric Flow Rate Q (GPH) Pressure at Cavitation PA (psi-a) 14.72 17.70 22.44 28.78 36.95 47.15 b) Next, at a constant surface pressure of 14.696 psi, the suction pressure (P2), discharge pressure (P3), and input power to the pump (Win) are measured at various volumetric flow rates. Note that the suction and discharge pressure gauges are located right at the pump inlet and outlet respectively. Using the data in the table below, calculate the pump head Hp (ft), hydraulic power w of the pump (hp), and the pump efficiency ne (%) at each flow rate; use a table to present your results. 0 1,000 2,000 3,000 4,000 5,000 6,000 0.15 0.01 -0.16 -0.36 -0.62 -0.87 -1.33 Volumetric Flow Rate Q (GPH) Suction Pressure P, (psi-g) Discharge Pressure Ps (psi-g) Power Input to Pump Win (hp) 87.10 85.35 81.99 74.71 62.95 48.60 29.74 3.45 4.01 4.48 4.78 4.96 5.06 5.09 c) Using Excel, make a single figure that displays all the NPSHR (ft), Hp (ft), and no (%)together by plotting NPSHR and Hp on the primary vertical axis, ne on the secondary vertical axis, and Q (GPH) on the horizontal axis Step by Step Solution
There are 3 Steps involved in it
Step: 1

Get Instant Access to Expert-Tailored Solutions
See step-by-step solutions with expert insights and AI powered tools for academic success
Step: 2

Step: 3
Ace Your Homework with AI
Get the answers you need in no time with our AI-driven, step-by-step assistance
Get Started
Chemical Process Safety Fundamentals With Applications
Authors: Daniel A. Crowl, Joseph F. Louvar
3rd Edition
0131382268, 978-0131382268