Answered step by step
Verified Expert Solution
Question
1 Approved Answer
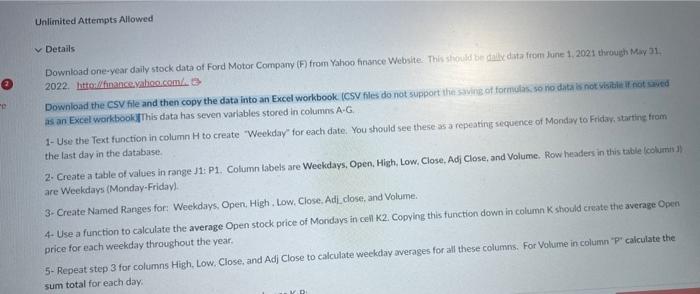
please show the formula for step 4 Details Downkad one-year daily stock data of Ford Motor Company (F) from Yahoo finance Website- This should ben
please show the formula for step 4 
Details Downkad one-year daily stock data of Ford Motor Company (F) from Yahoo finance Website- This should ben oallic dista fromin June 1.2021 through May 31 . 2022. htteill financevahooccomhis 3 Download the CSV file and then copy the data into an Excel workbook. (CSV files do not support thin saving of tornulak so rio data is not visitaik if int saied as an Excel worktook: This data has seven varlables stored in columns A.G. 1- Use the Text function in column H to create "Weekday" for each date. You should see these as a repeating sequence- of Mondin to Fridar, atartine from the last day in the database. 2. Create a table of values in range J1: P1. Column labels are Weckdays, Open, High, Low, Close. Adj Close, and Volume, Row headers in this table (colvmiti 1) are Weeladays (Monday-Friday). 3. Create Named Ranges for: Weekdays, Open, High. Low, Close, Adl_close, and Volume. 4. Use a function to calculate the average Open stock price of Mondays in cell K2. Copying this function down in column K should cieate the average Open price for each weekday throughout the year. 5. Repeat step 3 for columns High. Low, Close, and Adj Close to calculate weekday averages for all these columns, For Volume in column "P" calculate the sum total for each day: Details Downkad one-year daily stock data of Ford Motor Company (F) from Yahoo finance Website- This should ben oallic dista fromin June 1.2021 through May 31 . 2022. htteill financevahooccomhis 3 Download the CSV file and then copy the data into an Excel workbook. (CSV files do not support thin saving of tornulak so rio data is not visitaik if int saied as an Excel worktook: This data has seven varlables stored in columns A.G. 1- Use the Text function in column H to create "Weekday" for each date. You should see these as a repeating sequence- of Mondin to Fridar, atartine from the last day in the database. 2. Create a table of values in range J1: P1. Column labels are Weckdays, Open, High, Low, Close. Adj Close, and Volume, Row headers in this table (colvmiti 1) are Weeladays (Monday-Friday). 3. Create Named Ranges for: Weekdays, Open, High. Low, Close, Adl_close, and Volume. 4. Use a function to calculate the average Open stock price of Mondays in cell K2. Copying this function down in column K should cieate the average Open price for each weekday throughout the year. 5. Repeat step 3 for columns High. Low, Close, and Adj Close to calculate weekday averages for all these columns, For Volume in column "P" calculate the sum total for each day 
Step by Step Solution
There are 3 Steps involved in it
Step: 1

Get Instant Access to Expert-Tailored Solutions
See step-by-step solutions with expert insights and AI powered tools for academic success
Step: 2

Step: 3

Ace Your Homework with AI
Get the answers you need in no time with our AI-driven, step-by-step assistance
Get Started


