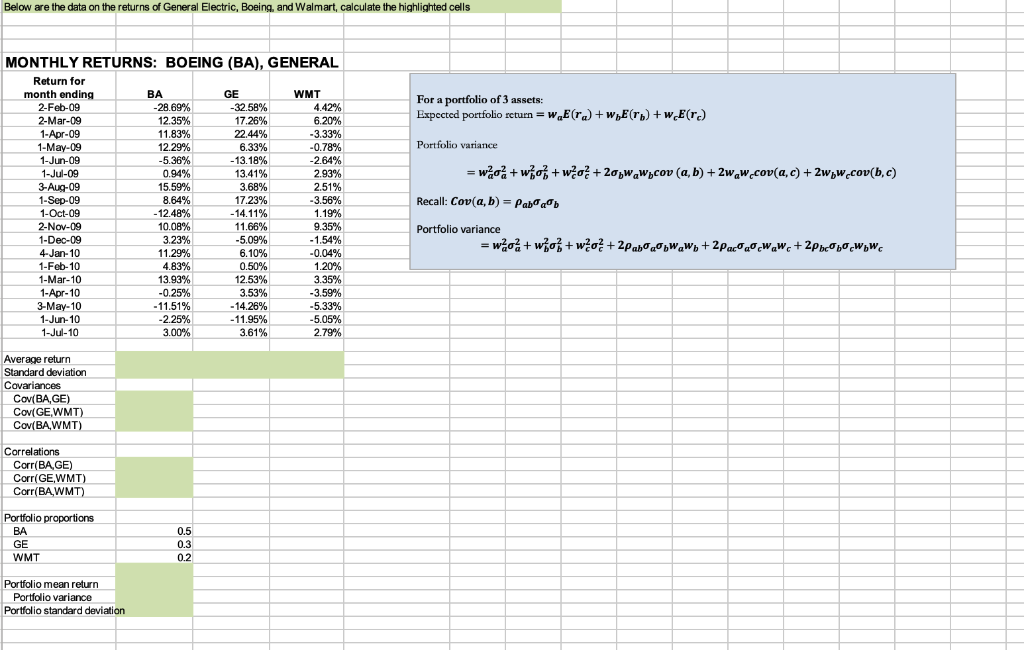
Please show the formulas used for the solution! thanks.
Below are the data on the returns of General Electric, Boeing, and Walmart, calculate the highlighted cells MONTHLY RETURNS: BOEING (BA), GENERAL Return for month ending 2-Feb-09 2-Mar-09 1-Apr-09 1-May-09 1-Jun-09 1-Jul-09 3-Aug-09 1-Sep-09 1-Oct-09 2-Nov-09 1-Dec-09 4-Jan-10 1-Feb-10 1-Mar-10 1-Apr-10 3-May-10 1-Jun-10 1-Jul-10 BA GE WMT For a portfolio of 3 assets Expected portfolio returnaE(ra) + whE(rb) + wgE(re) 28.69% 12.35% 11.83% 12.29% 536940 0.94% 15.59% 8.64% 12.48% 10.08% 3.23% 11.29% 4.83% 13.93% -0.25% 11.51% 2.25% 3.00% 3258% 17.26% 22.44% 6.33% 13.18% 13.41% 3.68% 17.23% 14.11% 11.66% 4.42% 6.20% 3.33% -0.78% 2.64% 2.93% 2.51% 3.56% 1.19% 9.35% 1.54% -0.04% 1.20% 3.35% -3.59% 5.33% 5.05% 2.79% Portfolio variance w + wFO2+ 2pwaWycou (a, b) + 2waw.cor(a, c) + 2Wywecov(b, c) Recall: Cou(a, b)-Pabab Portfolio variance 6.10% 050% 12.53% 3.53% 14.26% 11.95% 3.61% Average return Standard deviation Cov(BA,GE) Cov(GE,WMT Cov(BAWMT) Correlations Corr(BA GE) Corr(GE,WMT) Corr(BAWMT) Portfolio proportions BA GE WMT 0.2 Portfolio mean return Portfolio variance Portfolio standard deviation Below are the data on the returns of General Electric, Boeing, and Walmart, calculate the highlighted cells MONTHLY RETURNS: BOEING (BA), GENERAL Return for month ending 2-Feb-09 2-Mar-09 1-Apr-09 1-May-09 1-Jun-09 1-Jul-09 3-Aug-09 1-Sep-09 1-Oct-09 2-Nov-09 1-Dec-09 4-Jan-10 1-Feb-10 1-Mar-10 1-Apr-10 3-May-10 1-Jun-10 1-Jul-10 BA GE WMT For a portfolio of 3 assets Expected portfolio returnaE(ra) + whE(rb) + wgE(re) 28.69% 12.35% 11.83% 12.29% 536940 0.94% 15.59% 8.64% 12.48% 10.08% 3.23% 11.29% 4.83% 13.93% -0.25% 11.51% 2.25% 3.00% 3258% 17.26% 22.44% 6.33% 13.18% 13.41% 3.68% 17.23% 14.11% 11.66% 4.42% 6.20% 3.33% -0.78% 2.64% 2.93% 2.51% 3.56% 1.19% 9.35% 1.54% -0.04% 1.20% 3.35% -3.59% 5.33% 5.05% 2.79% Portfolio variance w + wFO2+ 2pwaWycou (a, b) + 2waw.cor(a, c) + 2Wywecov(b, c) Recall: Cou(a, b)-Pabab Portfolio variance 6.10% 050% 12.53% 3.53% 14.26% 11.95% 3.61% Average return Standard deviation Cov(BA,GE) Cov(GE,WMT Cov(BAWMT) Correlations Corr(BA GE) Corr(GE,WMT) Corr(BAWMT) Portfolio proportions BA GE WMT 0.2 Portfolio mean return Portfolio variance Portfolio standard deviation


