Please show the workings of calculations
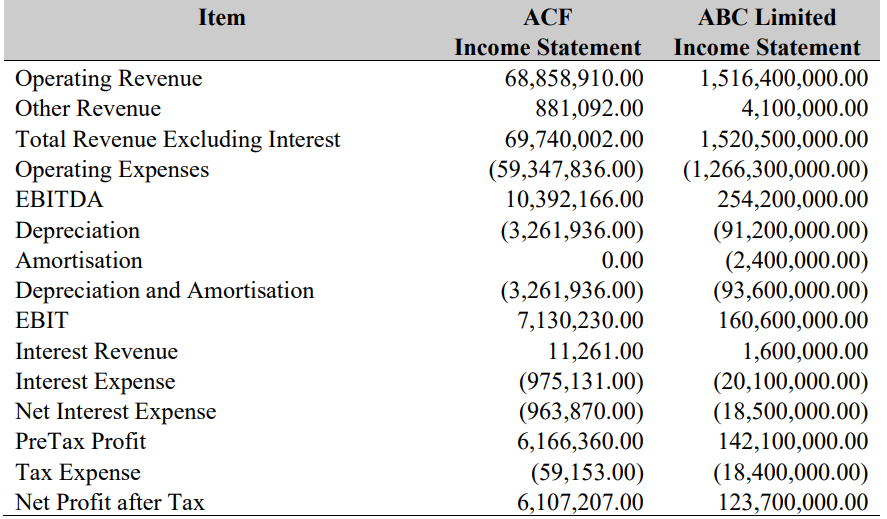
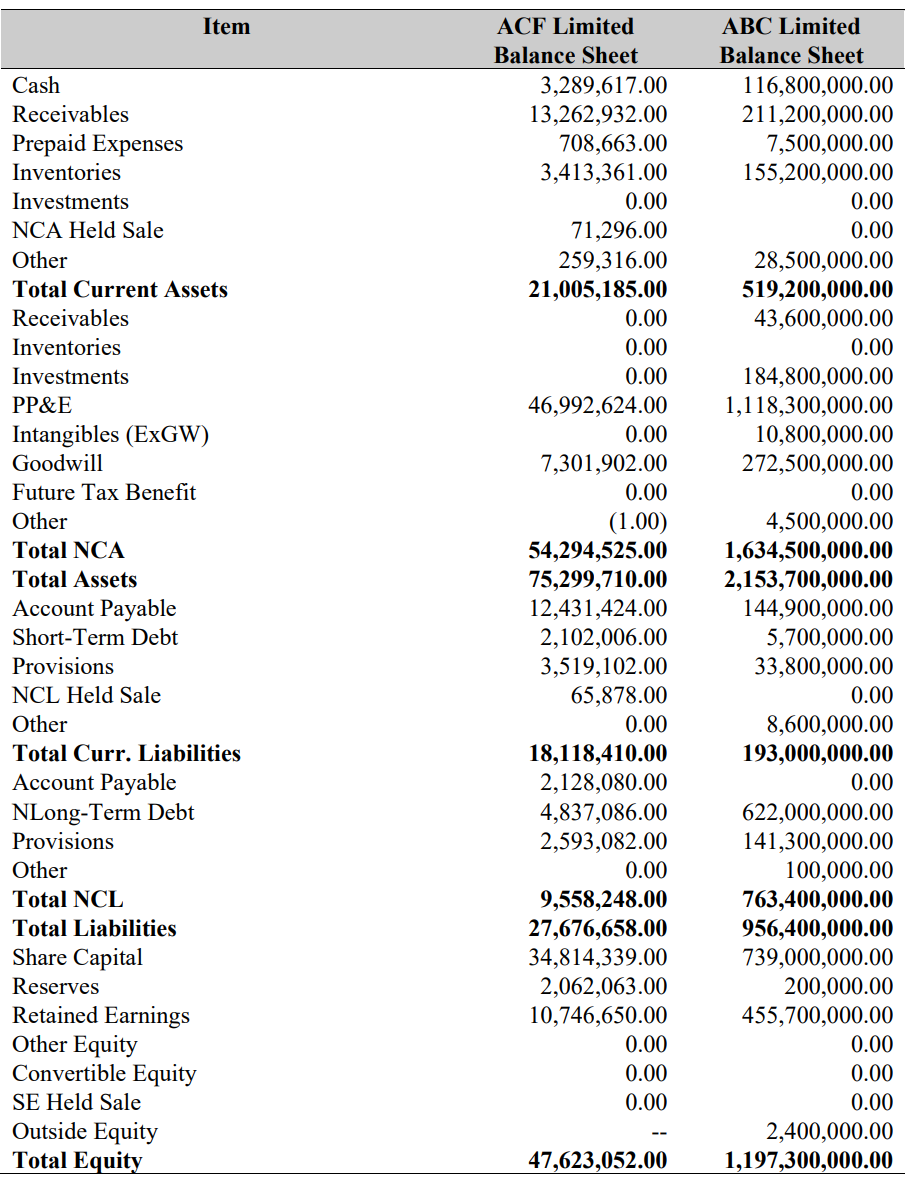
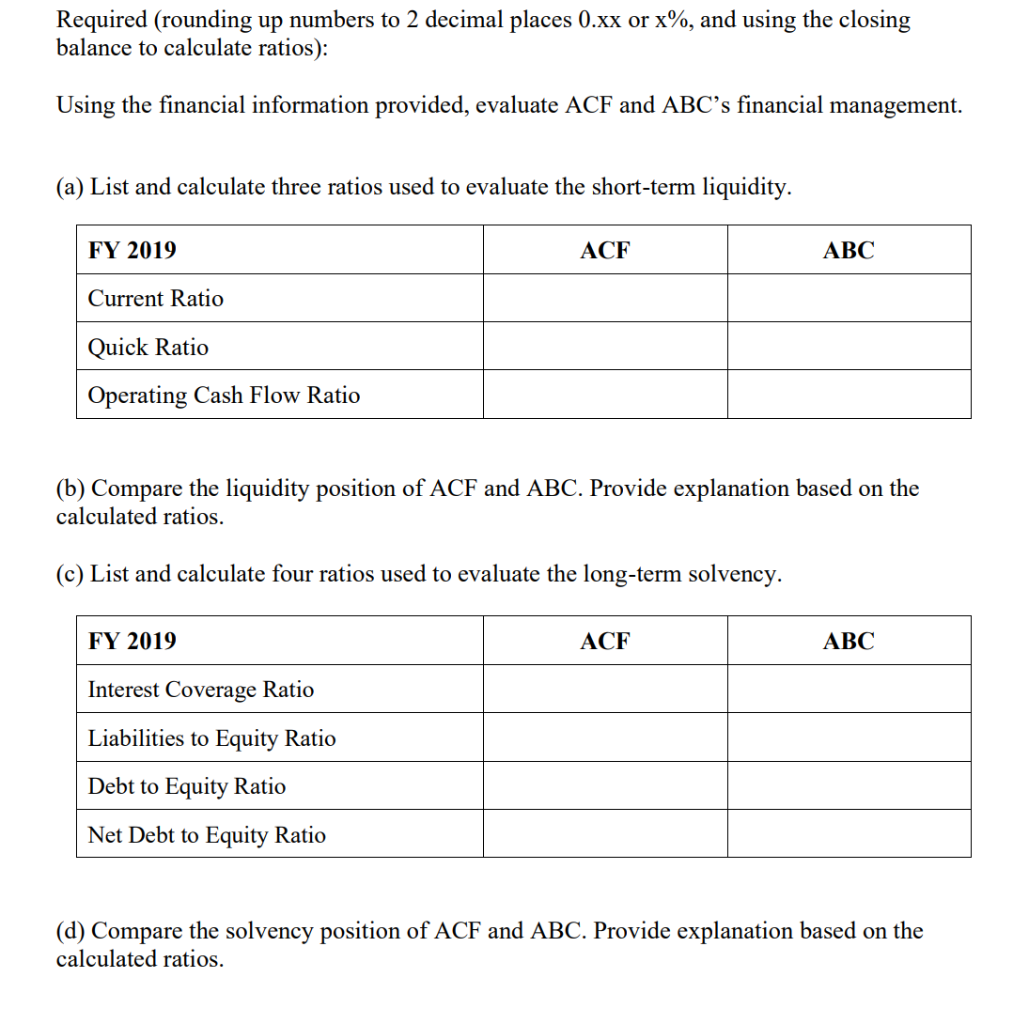
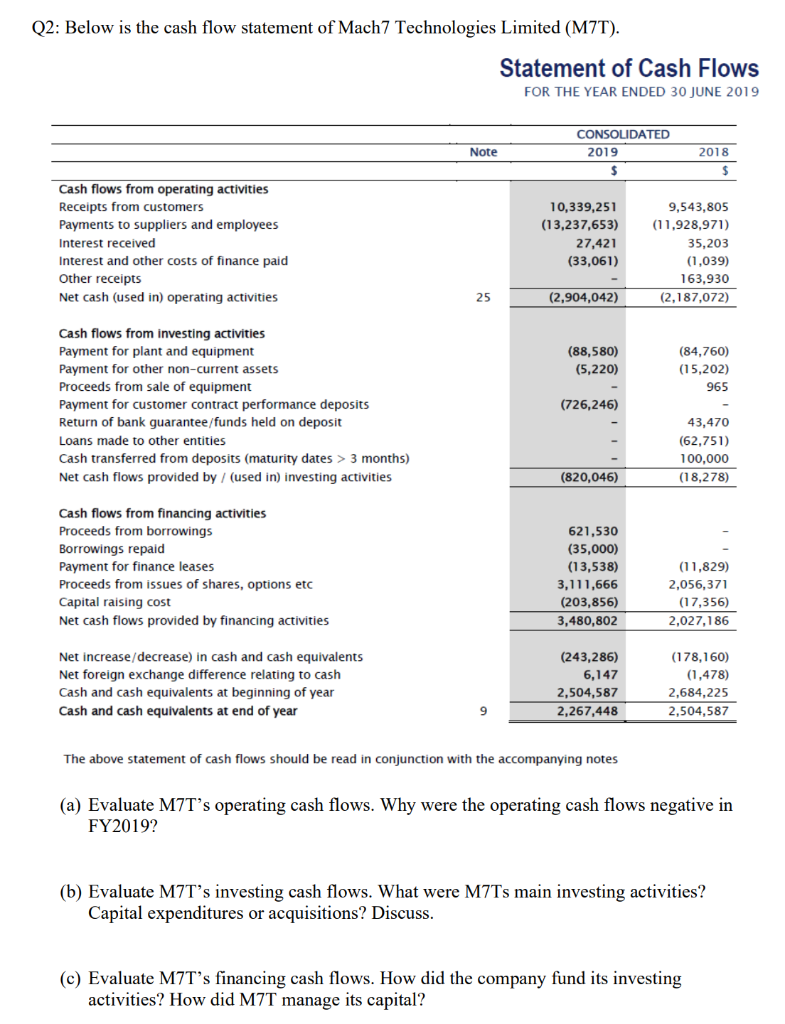
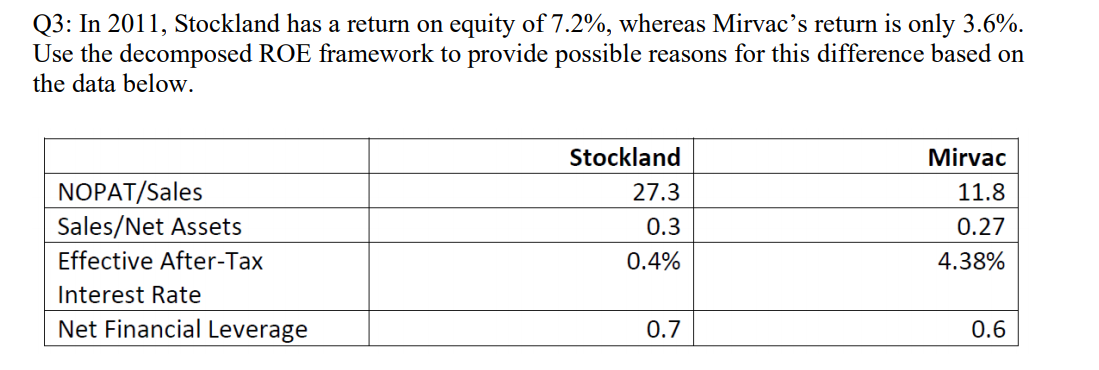
Item Operating Revenue Other Revenue Total Revenue Excluding Interest Operating Expenses EBITDA Depreciation Amortisation Depreciation and Amortisation EBIT Interest Revenue Interest Expense Net Interest Expense PreTax Profit Tax Expense Net Profit after Tax ACF Income Statement 68,858,910.00 881,092.00 69,740,002.00 (59,347,836.00) 10,392,166.00 (3,261,936.00) 0.00 (3,261,936.00) 7,130,230.00 11,261.00 (975,131.00) (963,870.00) 6,166,360.00 (59,153.00) 6,107,207.00 ABC Limited Income Statement 1,516,400,000.00 4,100,000.00 1,520,500,000.00 (1,266,300,000.00) 254,200,000.00 (91,200,000.00) (2,400,000.00) (93,600,000.00) 160,600,000.00 1,600,000.00 (20,100,000.00) (18,500,000.00) 142,100,000.00 (18,400,000.00) 123,700,000.00 Item Cash Receivables Prepaid Expenses Inventories Investments NCA Held Sale Other Total Current Assets Receivables Inventories Investments PP&E Intangibles (ExGW) Goodwill Future Tax Benefit Other Total NCA Total Assets Account Payable Short-Term Debt Provisions NCL Held Sale Other Total Curr. Liabilities Account Payable NLong-Term Debt Provisions Other Total NCL Total Liabilities Share Capital Reserves Retained Earnings Other Equity Convertible Equity SE Held Sale Outside Equity Total Equity ACF Limited Balance Sheet 3,289,617.00 13,262,932.00 708,663.00 3,413,361.00 0.00 71,296.00 259,316.00 21,005,185.00 0.00 0.00 0.00 46,992,624.00 0.00 7,301,902.00 0.00 (1.00) 54,294,525.00 75,299,710.00 12,431,424.00 2,102,006.00 3,519,102.00 65,878.00 0.00 18,118,410.00 2,128,080.00 4,837,086.00 2,593,082.00 0.00 9,558,248.00 27,676,658.00 34,814,339.00 2,062,063.00 10,746,650.00 0.00 0.00 0.00 ABC Limited Balance Sheet 116,800,000.00 211,200,000.00 7,500,000.00 155,200,000.00 0.00 0.00 28,500,000.00 519,200,000.00 43,600,000.00 0.00 184,800,000.00 1,118,300,000.00 10,800,000.00 272,500,000.00 0.00 4,500,000.00 1,634,500,000.00 2,153,700,000.00 144,900,000.00 5,700,000.00 33,800,000.00 0.00 8,600,000.00 193,000,000.00 0.00 622,000,000.00 141,300,000.00 100,000.00 763,400,000.00 956,400,000.00 739,000,000.00 200,000.00 455,700,000.00 0.00 0.00 0.00 2,400,000.00 1,197,300,000.00 47,623,052.00 Required (rounding up numbers to 2 decimal places 0.xx or x%, and using the closing balance to calculate ratios): Using the financial information provided, evaluate ACF and ABC's financial management. (a) List and calculate three ratios used to evaluate the short-term liquidity. FY 2019 ACF ABC Current Ratio Quick Ratio Operating Cash Flow Ratio (b) Compare the liquidity position of ACF and ABC. Provide explanation based on the calculated ratios. (c) List and calculate four ratios used to evaluate the long-term solvency. FY 2019 ACF ABC Interest Coverage Ratio Liabilities to Equity Ratio Debt to Equity Ratio Net Debt to Equity Ratio (d) Compare the solvency position of ACF and ABC. Provide explanation based on the calculated ratios. Q2: Below is the cash flow statement of Mach7 Technologies Limited (M7T). Statement of Cash Flows FOR THE YEAR ENDED 30 JUNE 2019 Note CONSOLIDATED 2019 $ 2018 Cash flows from operating activities Receipts from customers Payments to suppliers and employees Interest received Interest and other costs of finance paid Other receipts Net cash (used in) operating activities 10,339,251 (13,237,653) 27,421 (33,061) 9,543,805 (11,928,971) 35,203 (1,039) 163,930 (2,187,072) 25 (2,904,042) (88,580) (5,220) (84,760) (15,202) 965 Cash flows from investing activities Payment for plant and equipment Payment for other non-current assets Proceeds from sale of equipment Payment for customer contract performance deposits Return of bank guarantee/funds held on deposit Loans made to other entities Cash transferred from deposits (maturity dates > 3 months) Net cash flows provided by / (used in) investing activities (726,246) 43,470 (62,751) 100,000 (820,046) (18,278) Cash flows from financing activities Proceeds from borrowings Borrowings repaid Payment for finance leases Proceeds from issues of shares, options etc Capital raising cost Net cash flows provided by financing activities 621,530 (35,000) (13,538) 3,111,666 (203,856) 3,480,802 (11,829) 2,056,371 (17,356) 2,027,186 Net increase/ decrease) in cash and cash equivalents Net foreign exchange difference relating to cash Cash and cash equivalents at beginning of year Cash and cash equivalents at end of year (243,286) 6,147 2,504,587 2,267,448 (178,160) (1,478) 2,684,225 2,504,587 9 The above statement of cash flows should be read in conjunction with the accompanying notes (a) Evaluate M7T's operating cash flows. Why were the operating cash flows negative in FY2019? (b) Evaluate M7T's investing cash flows. What were M7Ts main investing activities? Capital expenditures or acquisitions? Discuss. (c) Evaluate M7T's financing cash flows. How did the company fund its investing activities? How did M7T manage its capital? Q3: In 2011, Stockland has a return on equity of 7.2%, whereas Mirvac's return is only 3.6%. Use the decomposed ROE framework to provide possible reasons for this difference based on the data below. NOPAT/Sales Sales/Net Assets Effective After-Tax Interest Rate Net Financial Leverage Stockland 27.3 0.3 0.4% Mirvac 11.8 0.27 4.38% 0.7 0.6