 Please show work and formulas on how to get the answer
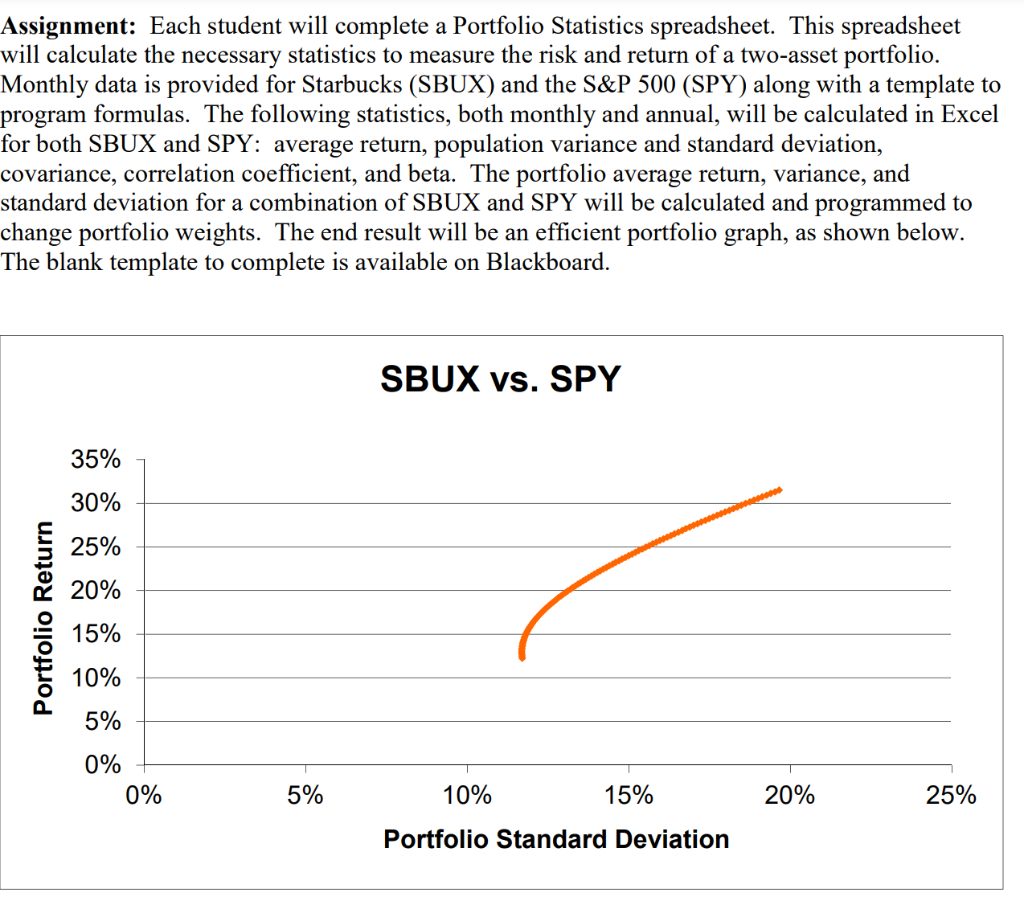
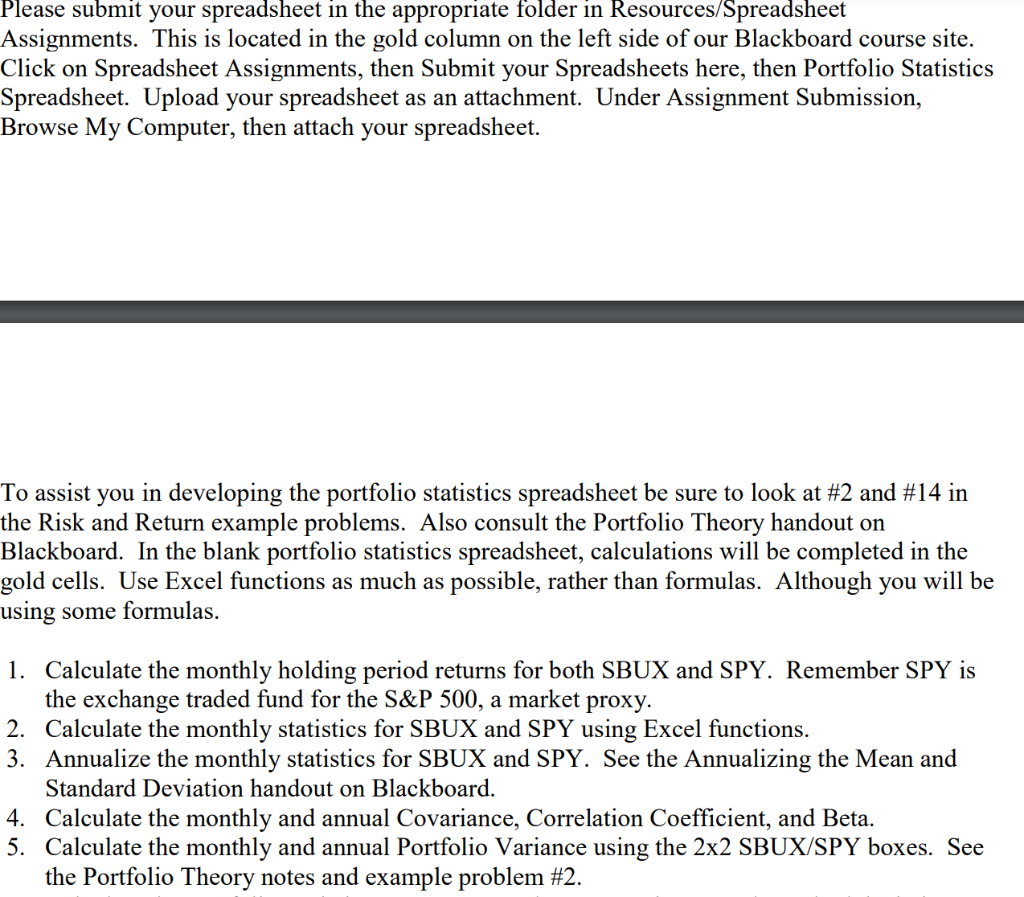
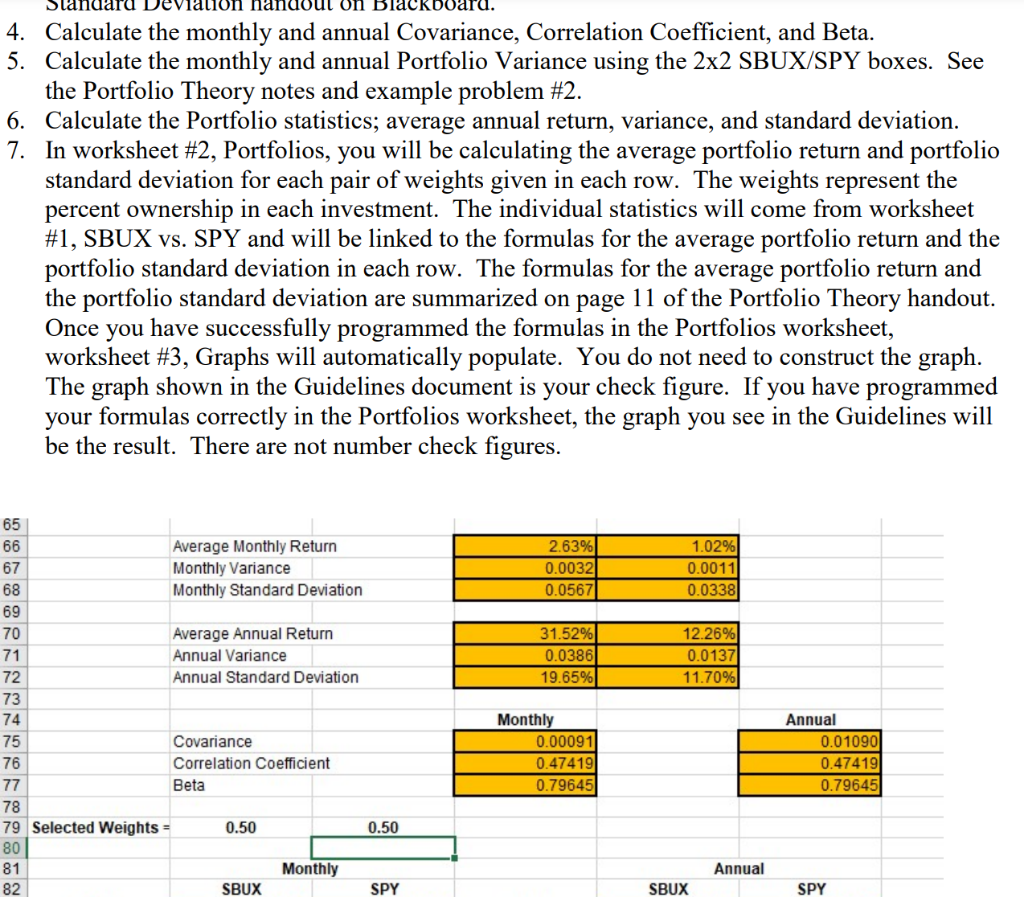
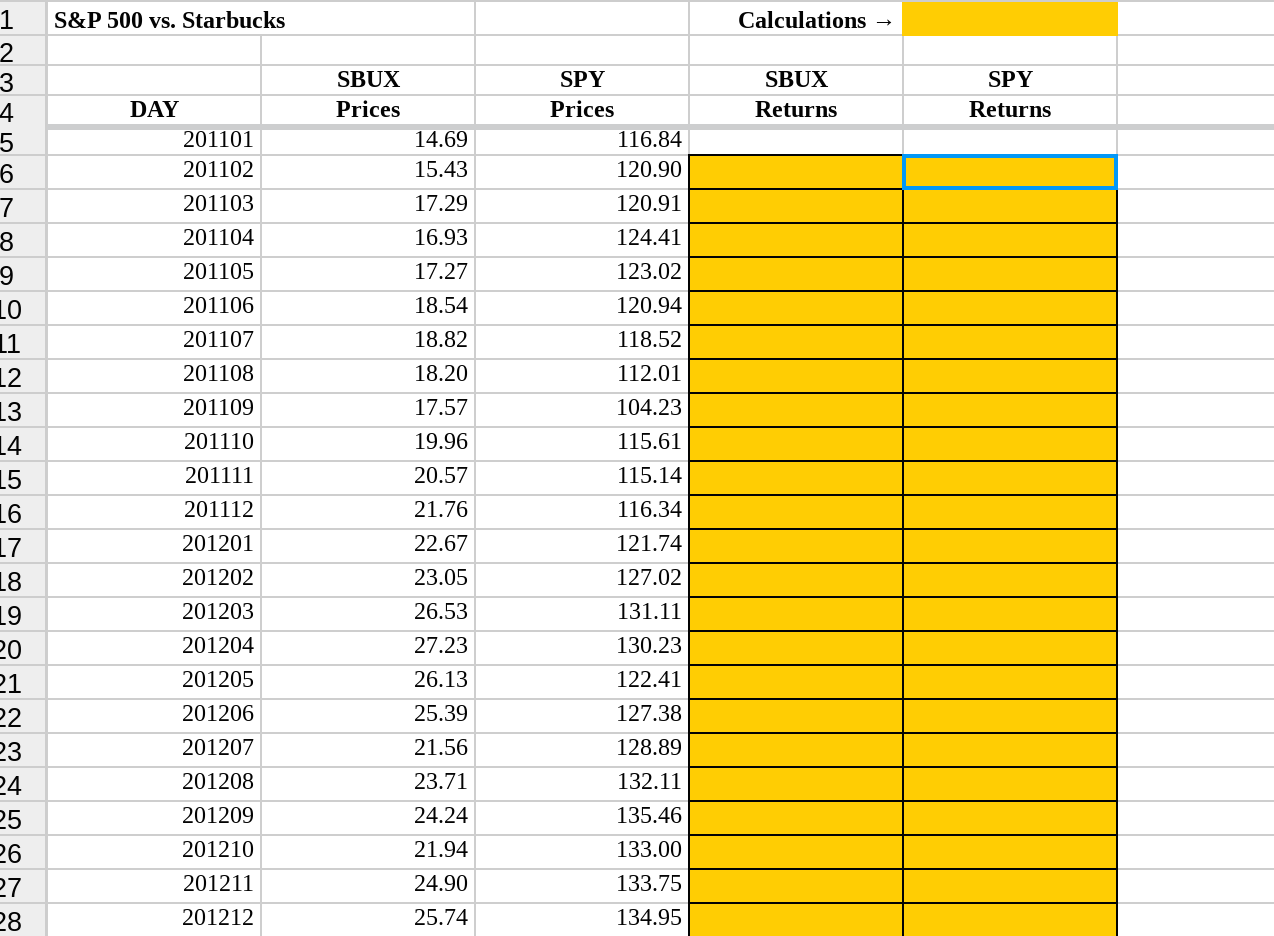
Assignment: Each student will complete a Portfolio Statistics spreadsheet. This spreadsheet will calculate the necessary statistics to measure the risk and return of a two-asset portfolio. Monthly data is provided for Starbucks (SBUX) and the S&P 500 (SPY) along with a template to program formulas. The following statistics, both monthly and annual, will be calculated in Excel for both SBUX and SPY: average return, population variance and standard deviation, covariance, correlation coefficient, and beta. The portfolio average return, variance, and standard deviation for a combination of SBUX and SPY will be calculated and programmed to change portfolio weights. The end result will be an efficient portfolio graph, as shown below. The blank template to complete is available on Blackboard. SBUX vs. SPY 35% 30% 25% 20% Portfolio Return 15% 10% 5% 0% 0% 5% 10% 15% 20% 25% Portfolio Standard Deviation Please submit your spreadsheet in the appropriate folder in Resources/Spreadsheet Assignments. This is located in the gold column on the left side of our Blackboard course site. Click on Spreadsheet Assignments, then Submit your Spreadsheets here, then Portfolio Statistics Spreadsheet. Upload your spreadsheet as an attachment. Under Assignment Submission, Browse My Computer, then attach your spreadsheet. To assist you in developing the portfolio statistics spreadsheet be sure to look at #2 and #14 in the Risk and Return example problems. Also consult the Portfolio Theory handout on Blackboard. In the blank portfolio statistics spreadsheet, calculations will be completed in the gold cells. Use Excel functions as much as possible, rather than formulas. Although you will be using some formulas. 1. Calculate the monthly holding period returns for both SBUX and SPY. Remember SPY is the exchange traded fund for the S&P 500, a market proxy. 2. Calculate the monthly statistics for SBUX and SPY using Excel functions. 3. Annualize the monthly statistics for SBUX and SPY. See the Annualizing the Mean and Standard Deviation handout on Blackboard. 4. Calculate the monthly and annual Covariance, Correlation Coefficient, and Beta. 5. Calculate the monthly and annual Portfolio Variance using the 2x2 SBUX/SPY boxes. See the Portfolio Theory notes and example problem #2. out on Black pard. 4. Calculate the monthly and annual Covariance, Correlation Coefficient, and Beta. 5. Calculate the monthly and annual Portfolio Variance using the 2x2 SBUX/SPY boxes. See the Portfolio Theory notes and example problem #2. 6. Calculate the Portfolio statistics; average annual return, variance, and standard deviation. 7. In worksheet #2, Portfolios, you will be calculating the average portfolio return and portfolio standard deviation for each pair of weights given in each row. The weights represent the percent ownership in each investment. The individual statistics will come from worksheet #1, SBUX vs. SPY and will be linked to the formulas for the average portfolio return and the portfolio standard deviation in each row. The formulas for the average portfolio return and the portfolio standard deviation are summarized on page 11 of the Portfolio Theory handout. Once you have successfully programmed the formulas in the Portfolios worksheet, worksheet #3, Graphs will automatically populate. You do not need to construct the graph. The graph shown in the Guidelines document is your check figure. If you have programmed your formulas correctly in the Portfolios worksheet, the graph you see in the Guidelines will be the result. There are not number check figures. 2.63% 0.0032 0.0567 1.02% 0.0011 0.0338 31.52% 0.0386 19.65% 12.26% 0.0137 11.70% 88897289mm 65 66 Average Monthly Return 67 Monthly Variance 68 Monthly Standard Deviation 69 70 Average Annual Return 71 Annual Variance Annual Standard Deviation 73 74 75 Covariance 76 Correlation coefficient 77 Beta 78 79 Selected Weights = 0.50 0.50 80 81 Monthly 82 SBUX SPY Monthly 0.00091 0.47419 0.79645 Annual 0.01090 0.47419 0.79645 Annual SBUX SPY S&P 500 vs. Starbucks Calculations SBUX Prices SBUX Returns SPY Returns DAY 201101 201102 201103 SPY Prices 116.84 120.90 120.91 201104 124.41 123.02 201105 201106 201107 201108 14.69 15.43 17.29 16.93 17.27 18.54 18.82 18.20 17.57 19.96 20.57 21.76 201109 1 2 3 4. 5 6 7 8 9 LO 11 12 13 14 15 16 17 18 19 20 21 22 23 24 25 26 27 28 120.94 118.52 112.01 104.23 115.61 115.14 116.34 121.74 201110 201111 22.67 201112 201201 201202 201203 201204 23.05 26.53 27.23 26.13 25.39 21.56 23.71 127.02 131.11 130.23 122.41 127.38 128.89 201205 201206 201207 201208 201209 201210 201211 201212 132.11 135.46 133.00 24.24 21.94 24.90 25.74 133.75 134.95 SBUX Portfolio STD Portfolio R SPY 1.00 0 0.01 0.99 0.98 0.02 0.03 0.04 0.05 0.97 0.96 0.95 0.94 0.93 0.92 0.06 0.07 0.08 0.09 0.91 0.90 0.89 1 2 3 4 5 6 7 8 9 10 11 12 13 14 15 16 17 18 19 20 21 22 23 24 25 26 27 28 0.10 0.11 0.12 0.13 0.88 0.87 0.14 0.86 0.15 0.85 0.84 0.16 0.17 0.18 0.83 0.82 0.19 0.81 0.20 0.80 0.21 0.22 0.79 0.78 0.23 0.77 0.24 0.76 0.25 0.75 120 fo A B D E F G I J K L 1 2 3 4 5 6 7 8 9 10 11 12 13 14 15 16 17 18 19 20 21 22 23 24 25 26 27 28 29 30 31 32 33 34 35 36 SBUX 0 0.01 0.02 0.03 0.04 0.05 0.06 0.07 0.08 0.09 0.10 0.11 0.12 0.13 0.14 0.15 0.16 0.17 0.18 0.19 0.20 0.21 0.22 0.23 0.24 0.25 0.26 0.27 0.28 0.29 0.30 0.31 0.32 0.33 SPY 1.00 0.99 0.98 0.97 0.96 0.95 0.94 0.93 0.92 0.91 0.90 0.89 0.88 0.87 0.86 0.85 0.84 0.83 0.82 0.81 0.80 0.79 0.78 0.77 0.76 0.75 0.74 0.73 0.72 0.71 0.70 0.69 0.68 0.67 Portfolio STD 11.70% 11.68% 11.66% 11.64% 11.63% 11.61% 11.60% 11.60% 11.59% 11.59% 11.59% 11.60% 11.60% 11.61% 11.62% 11.64% 11.65% 11.67% 11.69% 11.72% 11.75% 11.77% 11.81% 11.84% 11.88% 11.92% 11.96% 12.00% 12.05% 12.10% 12.15% 12.20% 12.26% 12.32% Portfolio R 12.26% 12.45% 12.64% 12.83% 13.03% 13.22% 13.41% 13.60% 13.80% 13.99% 14.18% 14.37% 14.57% 14.76% 14.95% 15.14% 15.34% 15.53% 15.72% 15.92% 16.11% 16.30% 16.49% 16.69% 16.88% 17.07% 17.26% 17.46% 17.65% 17.84% 18.03% 18.23% 18.42% 18.61% CDIIY SAY Datalia Tranh Assignment: Each student will complete a Portfolio Statistics spreadsheet. This spreadsheet will calculate the necessary statistics to measure the risk and return of a two-asset portfolio. Monthly data is provided for Starbucks (SBUX) and the S&P 500 (SPY) along with a template to program formulas. The following statistics, both monthly and annual, will be calculated in Excel for both SBUX and SPY: average return, population variance and standard deviation, covariance, correlation coefficient, and beta. The portfolio average return, variance, and standard deviation for a combination of SBUX and SPY will be calculated and programmed to change portfolio weights. The end result will be an efficient portfolio graph, as shown below. The blank template to complete is available on Blackboard. SBUX vs. SPY 35% 30% 25% 20% Portfolio Return 15% 10% 5% 0% 0% 5% 10% 15% 20% 25% Portfolio Standard Deviation Please submit your spreadsheet in the appropriate folder in Resources/Spreadsheet Assignments. This is located in the gold column on the left side of our Blackboard course site. Click on Spreadsheet Assignments, then Submit your Spreadsheets here, then Portfolio Statistics Spreadsheet. Upload your spreadsheet as an attachment. Under Assignment Submission, Browse My Computer, then attach your spreadsheet. To assist you in developing the portfolio statistics spreadsheet be sure to look at #2 and #14 in the Risk and Return example problems. Also consult the Portfolio Theory handout on Blackboard. In the blank portfolio statistics spreadsheet, calculations will be completed in the gold cells. Use Excel functions as much as possible, rather than formulas. Although you will be using some formulas. 1. Calculate the monthly holding period returns for both SBUX and SPY. Remember SPY is the exchange traded fund for the S&P 500, a market proxy. 2. Calculate the monthly statistics for SBUX and SPY using Excel functions. 3. Annualize the monthly statistics for SBUX and SPY. See the Annualizing the Mean and Standard Deviation handout on Blackboard. 4. Calculate the monthly and annual Covariance, Correlation Coefficient, and Beta. 5. Calculate the monthly and annual Portfolio Variance using the 2x2 SBUX/SPY boxes. See the Portfolio Theory notes and example problem #2. out on Black pard. 4. Calculate the monthly and annual Covariance, Correlation Coefficient, and Beta. 5. Calculate the monthly and annual Portfolio Variance using the 2x2 SBUX/SPY boxes. See the Portfolio Theory notes and example problem #2. 6. Calculate the Portfolio statistics; average annual return, variance, and standard deviation. 7. In worksheet #2, Portfolios, you will be calculating the average portfolio return and portfolio standard deviation for each pair of weights given in each row. The weights represent the percent ownership in each investment. The individual statistics will come from worksheet #1, SBUX vs. SPY and will be linked to the formulas for the average portfolio return and the portfolio standard deviation in each row. The formulas for the average portfolio return and the portfolio standard deviation are summarized on page 11 of the Portfolio Theory handout. Once you have successfully programmed the formulas in the Portfolios worksheet, worksheet #3, Graphs will automatically populate. You do not need to construct the graph. The graph shown in the Guidelines document is your check figure. If you have programmed your formulas correctly in the Portfolios worksheet, the graph you see in the Guidelines will be the result. There are not number check figures. 2.63% 0.0032 0.0567 1.02% 0.0011 0.0338 31.52% 0.0386 19.65% 12.26% 0.0137 11.70% 88897289mm 65 66 Average Monthly Return 67 Monthly Variance 68 Monthly Standard Deviation 69 70 Average Annual Return 71 Annual Variance Annual Standard Deviation 73 74 75 Covariance 76 Correlation coefficient 77 Beta 78 79 Selected Weights = 0.50 0.50 80 81 Monthly 82 SBUX SPY Monthly 0.00091 0.47419 0.79645 Annual 0.01090 0.47419 0.79645 Annual SBUX SPY S&P 500 vs. Starbucks Calculations SBUX Prices SBUX Returns SPY Returns DAY 201101 201102 201103 SPY Prices 116.84 120.90 120.91 201104 124.41 123.02 201105 201106 201107 201108 14.69 15.43 17.29 16.93 17.27 18.54 18.82 18.20 17.57 19.96 20.57 21.76 201109 1 2 3 4. 5 6 7 8 9 LO 11 12 13 14 15 16 17 18 19 20 21 22 23 24 25 26 27 28 120.94 118.52 112.01 104.23 115.61 115.14 116.34 121.74 201110 201111 22.67 201112 201201 201202 201203 201204 23.05 26.53 27.23 26.13 25.39 21.56 23.71 127.02 131.11 130.23 122.41 127.38 128.89 201205 201206 201207 201208 201209 201210 201211 201212 132.11 135.46 133.00 24.24 21.94 24.90 25.74 133.75 134.95 SBUX Portfolio STD Portfolio R SPY 1.00 0 0.01 0.99 0.98 0.02 0.03 0.04 0.05 0.97 0.96 0.95 0.94 0.93 0.92 0.06 0.07 0.08 0.09 0.91 0.90 0.89 1 2 3 4 5 6 7 8 9 10 11 12 13 14 15 16 17 18 19 20 21 22 23 24 25 26 27 28 0.10 0.11 0.12 0.13 0.88 0.87 0.14 0.86 0.15 0.85 0.84 0.16 0.17 0.18 0.83 0.82 0.19 0.81 0.20 0.80 0.21 0.22 0.79 0.78 0.23 0.77 0.24 0.76 0.25 0.75 120 fo A B D E F G I J K L 1 2 3 4 5 6 7 8 9 10 11 12 13 14 15 16 17 18 19 20 21 22 23 24 25 26 27 28 29 30 31 32 33 34 35 36 SBUX 0 0.01 0.02 0.03 0.04 0.05 0.06 0.07 0.08 0.09 0.10 0.11 0.12 0.13 0.14 0.15 0.16 0.17 0.18 0.19 0.20 0.21 0.22 0.23 0.24 0.25 0.26 0.27 0.28 0.29 0.30 0.31 0.32 0.33 SPY 1.00 0.99 0.98 0.97 0.96 0.95 0.94 0.93 0.92 0.91 0.90 0.89 0.88 0.87 0.86 0.85 0.84 0.83 0.82 0.81 0.80 0.79 0.78 0.77 0.76 0.75 0.74 0.73 0.72 0.71 0.70 0.69 0.68 0.67 Portfolio STD 11.70% 11.68% 11.66% 11.64% 11.63% 11.61% 11.60% 11.60% 11.59% 11.59% 11.59% 11.60% 11.60% 11.61% 11.62% 11.64% 11.65% 11.67% 11.69% 11.72% 11.75% 11.77% 11.81% 11.84% 11.88% 11.92% 11.96% 12.00% 12.05% 12.10% 12.15% 12.20% 12.26% 12.32% Portfolio R 12.26% 12.45% 12.64% 12.83% 13.03% 13.22% 13.41% 13.60% 13.80% 13.99% 14.18% 14.37% 14.57% 14.76% 14.95% 15.14% 15.34% 15.53% 15.72% 15.92% 16.11% 16.30% 16.49% 16.69% 16.88% 17.07% 17.26% 17.46% 17.65% 17.84% 18.03% 18.23% 18.42% 18.61% CDIIY SAY Datalia Tranh