

Answered step by step
Verified Expert Solution
Question
1 Approved Answer
Please show work Net Profit Margin Operating Margin Return on Assets Return on Equity Revenue Total Cash Total Debt Current Ratio Price per share Earnings
Please show work
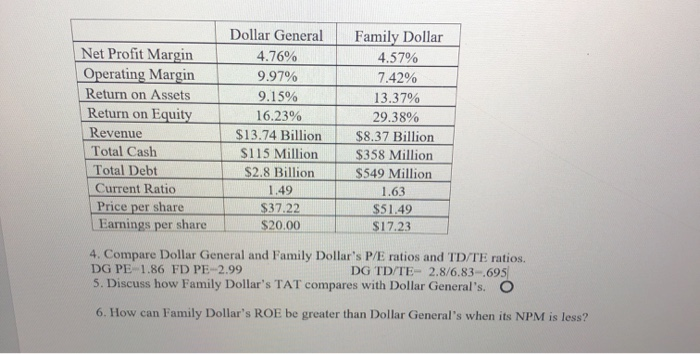
Net Profit Margin Operating Margin Return on Assets Return on Equity Revenue Total Cash Total Debt Current Ratio Price per share Earnings per share Dollar General 4.76% 9.97% 9.15% 16.23% $13.74 Billion $115 Million $2.8 Billion 1.49 $37.22 $20.00 Family Dollar 4.57% 7.42% 13.37% 29.38% $8.37 Billion $358 Million $549 Million 1.63 $51.49 $17.23 4. Compare Dollar General and Family Dollar's P/E ratios and TD/TE ratios. DG PE 1.86 FD PE-2.99 DG TD/TE- 2.8/6.83-695 5. Discuss how Family Dollar's TAT compares with Dollar General's. O 6. How can Family Dollar's ROE be greater than Dollar General's when its NPM is less Step by Step Solution
There are 3 Steps involved in it
Step: 1

Get Instant Access to Expert-Tailored Solutions
See step-by-step solutions with expert insights and AI powered tools for academic success
Step: 2

Step: 3
Ace Your Homework with AI
Get the answers you need in no time with our AI-driven, step-by-step assistance
Get Started
CAT Paper 8 Implementing Audit Procedures
Authors: BPP Professional Education
1st Edition
0751723126, 978-0751723120